Figure 3.
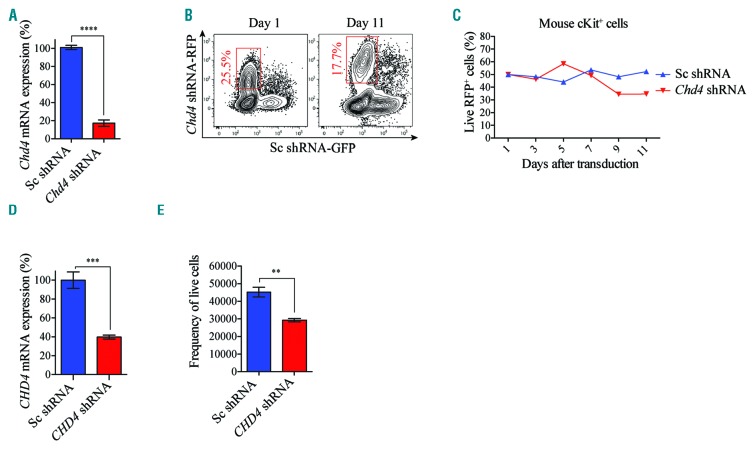
CHD4 inhibition causes minor effect in cell growth of normal blood cells in vitro. A. Bar charts represent real time PCR analysis of mRNA levels after shRNA-based knockdown of Chd4 relative to control cells transduced with vectors expressing scrambled shRNA, in sorted primary murine cKit+ BMs used in the competitive proliferation assays (Figure 3B,C), at 72 hours post transduction. mRNA levels were normalized to Hprt. The data is represented as the mean ±S.E.M., ****P<0.001 (unpaired t-test), n=3. B. Flow cytometry charts are representative plots of the percentage of live RFP+ Chd4 knockdown cKit+ cells (Chd4 shRNA-RFP) relative to GFP+ control cells (Sc shRNA-GFP) at the indicated time points. C. Line chart of a representative experiment of the percentage of Chd4 shRNA-RFP+ vs. Sc shRNA-GFP+ BMs propagated in suspension, normalized to 50% at the initial time point (Day one), determined by flow cytometry analysis at the indicated time points. D. Bar charts represent real time PCR analysis of mRNA levels after shRNA-based knockdown of CHD4, relative to control cells transduced with vectors expressing scrambled shRNA, in primary human CD34 enriched UCBs used in the cell growth assays (Figure 3E), 72 hours post transduction. mRNA levels were normalized to UBC. The data is represented as the mean ±S.E.M., ***P<0.005 (unpaired t-test), n=3. E. Bar chart of the total number of viable primary UCBs, transduced with shRNA against CHD4 (CHD4-shRNA), or a negative control vector (Sc-shRNA). The UCBs were propagated in suspension with supplemented cytokines and growth factors for 14 days. The number of viable UCBs was determined by flow cytometric analysis. **P<0.01 (unpaired t-test), n=3. mRNA: messenger ribonucleic acid; RFP: red fluorescent protein; GFP: green fluorescent protein; shRNA: short hairpin RNA.

