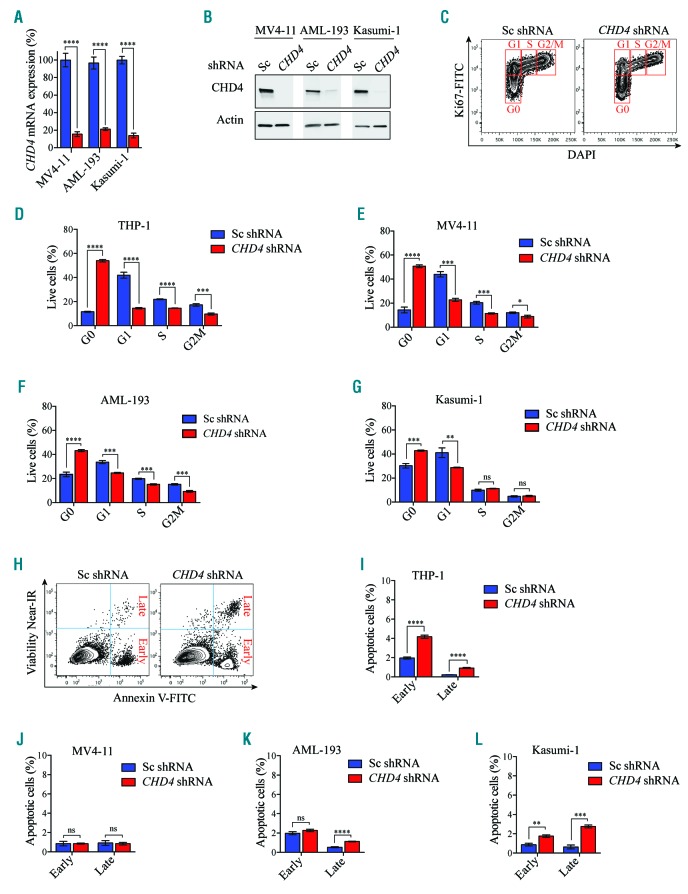
Figure 6.
CHD4 inhibition in AML cells causes an arrest in the G0 phase of the cell cycle. A. Bar charts represent real time PCR analysis of mRNA levels after shRNA-based knockdown of CHD4 in MV4-11, Kasumi-1 and AML-193 cells (knockdown of mRNA levels of CHD4 in THP-1 cells used in this assay is depicted in Figure 2A). The cells were used for apoptosis and cell cycle analysis (Figure 6C-L), relative to control samples transduced with negative control vectors expressing scrambled shRNA, at 72 hours post transduction. mRNA levels were normalized to UBC. The data is represented as the mean ±S.E.M., ****P<0.001 (unpaired t-test), n=3. B. Western blot analysis of CHD4 and Actin levels in MV4-11, AML-193 and Kasumi-1 cells, with and without knockdown of CHD4, (knockdown levels of CHD4 protein levels in the THP-1 cells used in this assay is depicted in Figure 2B). C. Representative flow cytometry charts of the THP-1 cells transduced with CHD4 shRNAs, or a negative control vector, stained with Ki-67 and DAPI, at 72 hours after transduction. Each cell cycle phase is highlighted in red. D-G. Bar graphs of flow cytometric quantification as the percentage of cells in each population of the indicated cell lines transduced with CHD4 shRNA or a control vector, at 72 hours post CHD4. The data is presented as mean ±S.E.M., ***P<0.005, ****P<0.001 (unpaired t-test), n=3. H. Representative flow cytometry charts of THP-1 cells transduced with CHD4 shRNAs, or a negative control vector, stained with near-IR and Annexin V, at 72 hours after transduction. I-L. Bar graphs illustrating flow cytometric quantification as the percentage of cells in each population of the indicated cell lines transduced with CHD4 shRNA or a control vector, at 72 hours post transduction. The data is presented as mean ±S.E.M. **P<0.01, ***P<0.005, ****P<0.001, (unpaired t-test), n=3. DAPI; 4’,6-diamidino-2-phenylindole; FITC: fluorescein isothiocyanate; ns: non-significant; Sc: scramble control; shRNA: short hairpin RNA; AML: acute myeloid leukemia; mRNA: messenger RNA.

