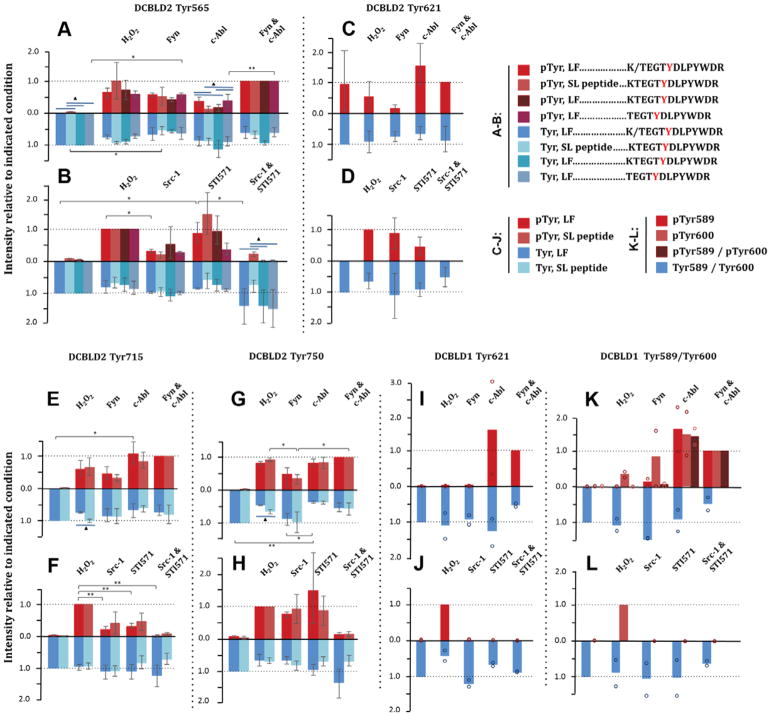
Figure 6.
Site-specific quantification of SFK- and Abl-dependent changes in tyrosine phosphorylation of DCBLD1 and DCBLD2 by label-free (LF) or SL peptides. Phosphorylated peptide intensities (red) were normalized to the co-transfection of Fyn and c-Abl in kinase co-expressed conditions, and H2O2 stimulation for inhibitor treatments. Unphosphorylated peptide ion intensities (blue) were normalized to the unstimulated condition, and the y-axes were inverted to visualize the shift in phosphorylation state. Error bars indicate the standard error of the mean. Column clusters display measurements for the same peptide and condition using different quantification methods. Significance between conditions, indicated by * (P < 0.05) or “ (P < 0.01), was determined with a one-way ANOVA with a post-hoc Tukey HSD (n=3 biological replicates). Blue bars and triangles indicate significant differences between quantification methods (P < 0.05) using either a student’s t-test for a two-method comparison, or the ANOVA/Tukey HSD for more than two methods. The quantification of four DCBLD2 phosphorylation sites are shown in (A–H), including one non-YxxP site. The quantification of three DCBLD1 sites are shown in I–L (n=2 biological replicates and individual data points are provided). Phosphorylation at DCBLD2 Tyr565 was quantified in alternative cleavage states individually, as well as in sum (K/TEGYDLPYWDR) as described in the methods.

