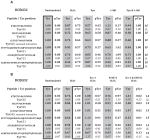
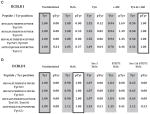
Table 2.
Quantification of DCBLD1 and DCBLD2 tyrosine phosphorylation with label-free (LF) and SL peptides (SL). Tabulated averages of normalized phosphorylated peptide and unphosphorylated peptide ion intensities as graphed in Figure 6. Phosphorylated peptide ion intensities were normalized (boxed values) either to dual co-expression of Fyn and c-Abl (in kinase co-expression studies) or H2O2 stimulation (in inhibitor treatment studies). Unphosphorylated peptide ion intensities were normalized to the unstimulated condition in all cases. Tabulated values for each DCBLD family member and the sets of conditions are as follows: kinase co-expression studies with (A) DCBLD2 and (B) DCBLD1 and inhibitor studies with (C) DCBLD2 and (D) DCBLD1.


