Figure 5.

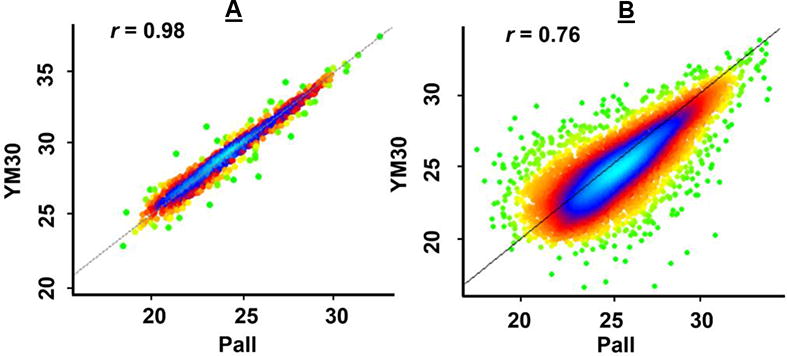
Pearson correlation analyses of q96FASP plate and single FASP filter. The density scatter plots between Pall and YM30 filter were shown as representative (Figure S-3 for details). Both proteins (A) and peptides (B) identified by the two filters were correlated. Combined results of five replicates of each filter were used for the analysis. The correlation r values were shown in the plot.
