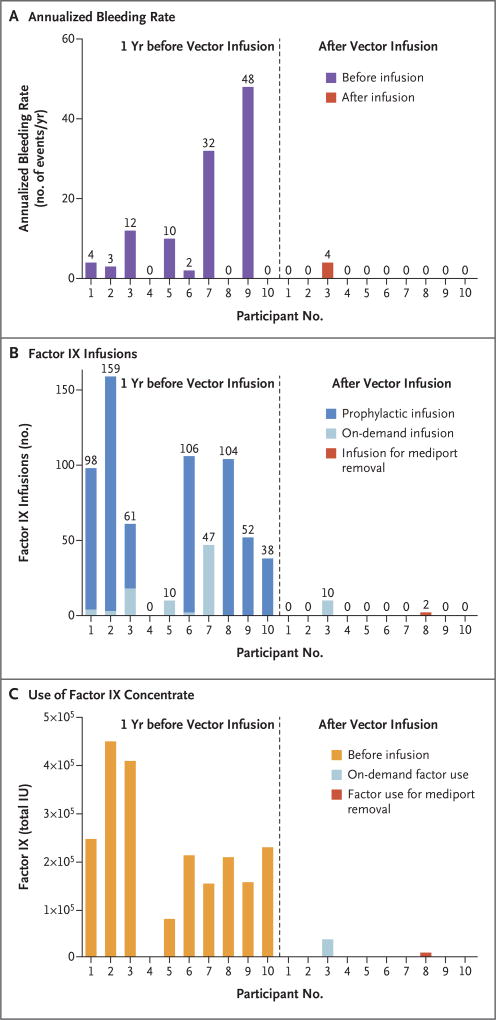
Figure 3. Comparison of Annualized Bleeding Rate, Number of Exogenous Factor IX Infusions, and Use of Factor IX Concentrate in the 52 Weeks before Screening and after Vector Infusion.
Panel A shows the annualized bleeding rate for each participant, Panel B the number of factor IX infusions, and Panel C the total number of international units (IU) of factor IX concentrate that were infused. The left side of each graph shows the values before vector administration (dashed line), and the right side the values after infusion. Values were normalized for each participant’s follow-up period. Significant reductions in the annualized bleeding rate (P = 0.02, W = 28), in the number of infusions (P = 0.004, W = 45), and in the amount of factor used (P = 0.004, W = 45) were observed in each participant after vector infusion.

