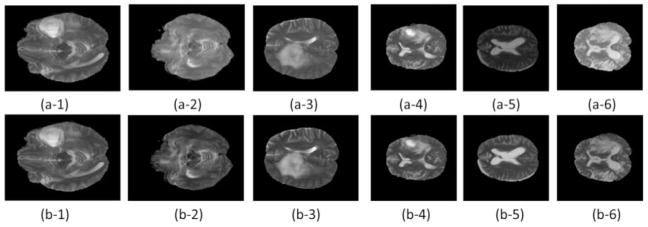
Fig. 1.
T2 scans before (top row) and after (bottom row) the proposed intensity normalization. (a-1)–(a-3) and (b-1)–(b-3) are randomly selected subjects from the BRATS 2013, and (a-4)–(a-6) and (b-4)–(b-6) are randomly selected subjects from the BRATS 2015. (a-1)–(a-6): before normalization; (b-1)–(b-6): after normalization. All the scans were preprocessed by N4ITK and the proposed normalization step 1.

