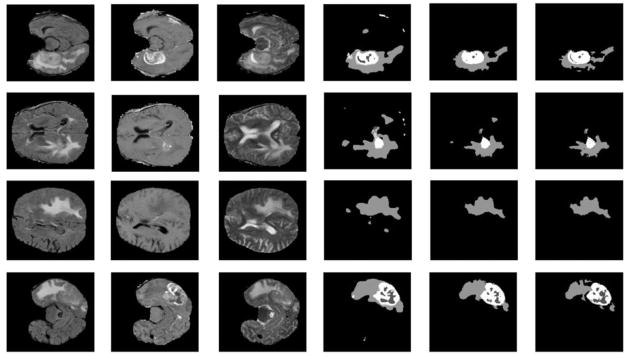
Fig. 6.
Example segmentation results on the BRATS 2013 Challenge dataset. The first and second rows show the segmentation results of the 50th and 80th slice of the axial view of Subject 0301. The third and fourth rows show the segmentation results of the 40th and 70th slice of the axial view of Subject 0308. From left to right: Flair, T1c, T2, segmentation results of FCNNs, segmentation results of FCNN + CRF, and segmentation results of FCNN + CRF + post-process. In the segmentation results, each gray level represents a tumor class, from low to high: necrosis, edema, non-enhancing core, and enhancing core.

