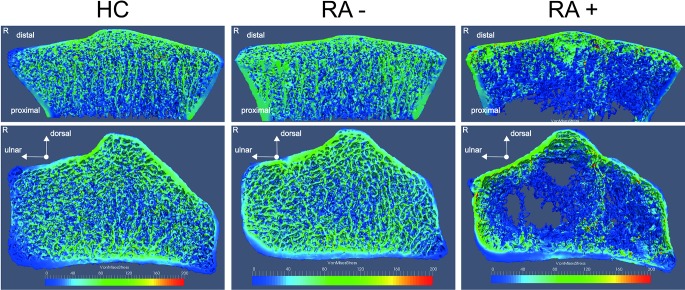
Figure 2.
Depiction of a finite element analysis-derived stress distribution image of a healthy control (HC) and anti-citrullinated protein antibody (ACPA)-negative (RA−) and ACPA-positive (RA+) rheumatoid arthritis (RA). Right and middle column display the right radius of a female patient with RA+ and RA−. Left column shows a gender-comparable and age-comparable HC. For comparison, full µFEA models (bottom) and cut through the radial bone (top) are shown to reveal differences in stress distribution for cortical and trabecular network. Colour map labels the von Mises stress (MPa) for described loading scenario.

