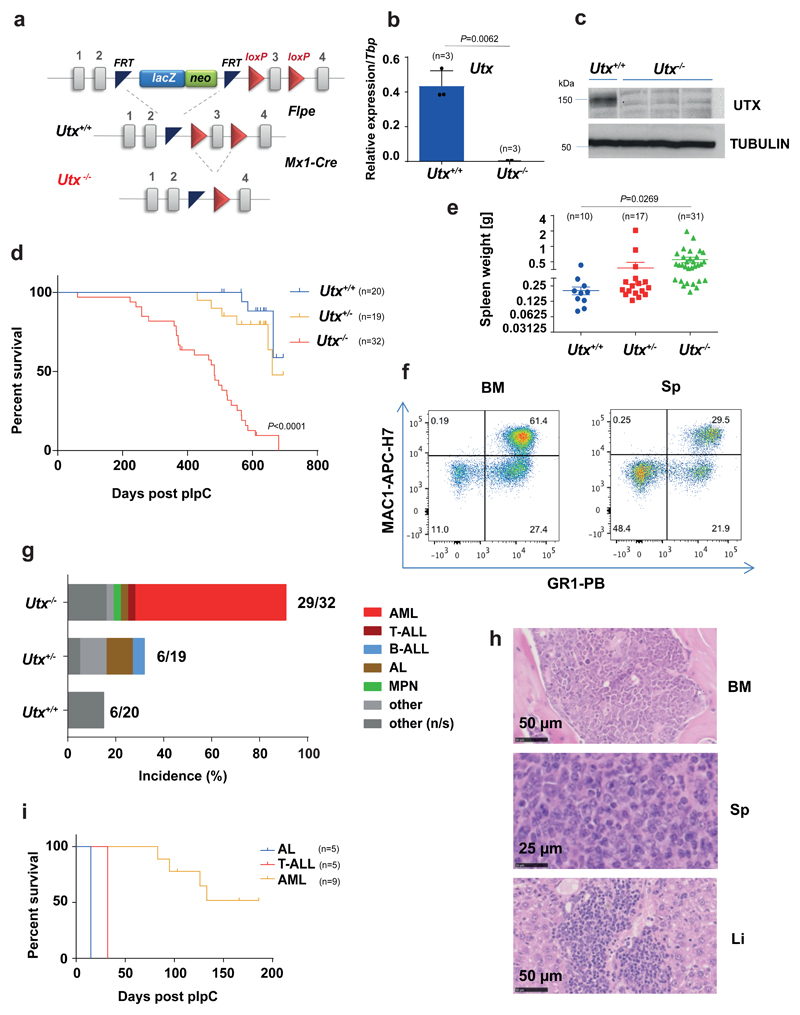
Figure 1. Utx-/- mice develop acute myeloid leukaemia.
(a) Structure of the Utx conditional allele. (b) qRT-PCR for exons 2-3 of Utx confirms Utx loss in Utx-/- HSPCs. The mean ± s.e.m is shown; n, number of mice per genotype; P by two-sided t-test, t=10.93, df=63. (c) Immunoblot showing loss of UTX protein in Utx-/- BM. Results of one representative experiment are shown (n=3 experiments). Uncropped images are shown in Supplementary Fig. 12. MW, molecular weight; α-tubulin, loading control (d) Kaplan-Meier survival curves for female Utx-/- (median 483 days), Utx+/- (median 661 days) and Utx+/+(median survival not reached) mice; n, number of mice per genotype; P by Log-rank (Mantel-Cox) test, df=2. (e) Spleen weights of Utx-/-, Utx+/- and Utx+/+mice; mean ± s.e.m. is shown; n, number of mice per genotype; P by one-way analysis of variance (ANOVA) with Bonferroni correction, t=2.554, df=55. (f) Characteristic MAC1/GR1 fluorescence activated cell sorting (FACS) analysis of BM and spleen cells from one diseased Utx-/- mice (similar result was observed in n=12). (g) Histopathological diagnoses of moribund mice of the indicated genotypes. The number of mice with a cancer diagnosis and the total analysed is indicated for each genotype. B-ALL: B-cell ALL; MPN: myeloproliferative neoplasm; other: non-hematological tumors; other (n/s), nonspecified. (h) Characteristic histology from one mouse with AML is shown (similar results were observed in n=20 mice). Sp, spleen; Li, liver. (i) Kaplan-Meier survival curves of mice transplanted with Utx-/- leukemias: AL (n=5), T-ALL (n=5), and two AML (n=9).

