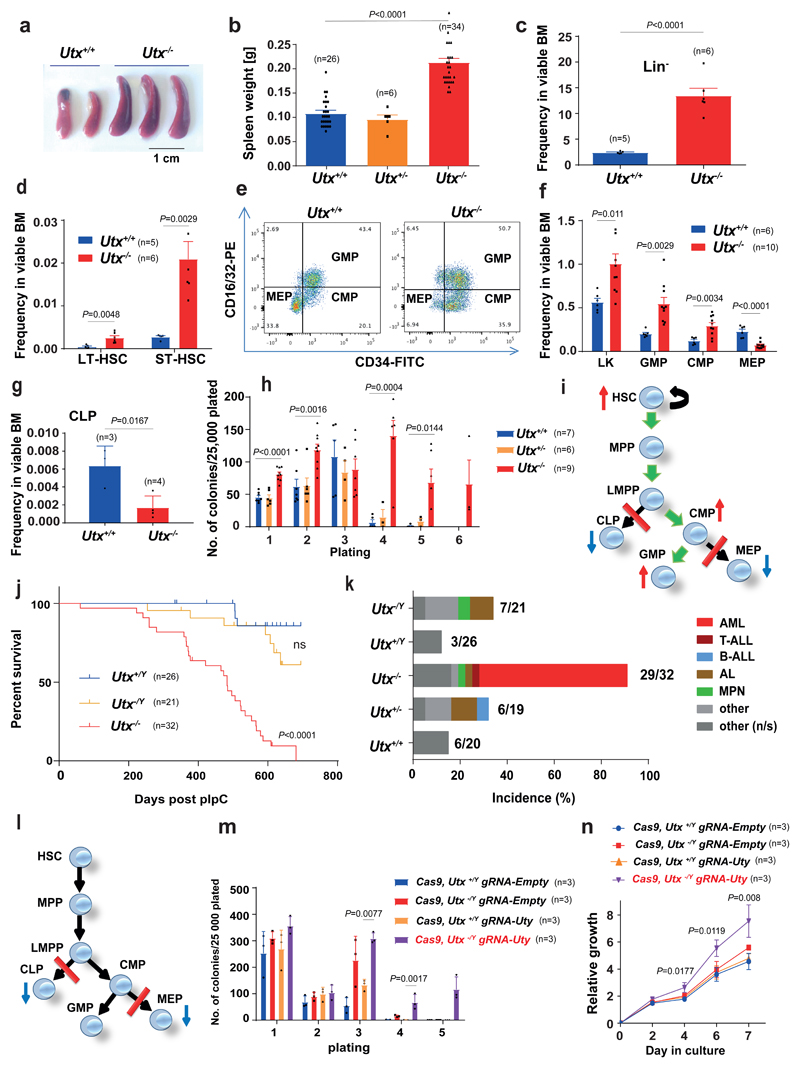
Figure 2. Utx loss expands hematopoietic stem/progenitor cells and imparts a myeloid bias, characteristics rescued by Uty.
a–d, Preleukemic spleens (a), spleen weights (t = 10.93, df = 63) (b) and frequency of Lin− cells (HSPCs) (t = 6.908, df = 9) (c), LT-HSCs (t = 3.712, df = 9) and ST-HSCs (d) in BM from Utx+/+ and Utx−/− mice (t = 4.049, df = 9). e, Representative flow cytometry profiles of CMP, GMP and MEP (similar results observed for 5 other mice). f, Quantification of Lin−Sca1−c-Kit+ (LK) (t = 2.927, df = 14), CMP (t = 3.518, df = 14), GMP (t = 3.608, df = 14) and MEP (t = 6.181, df = 15) from Utx+/+ and Utx−/− mice. g, CLP frequency in BM from Utx+/+ and Utx−/− mice (t = 3.534, df = 5). h, Serial replating of BM-derived colonies from Utx+/+, Utx+/− and Utx−/− (for Utx+/+ versus Utx−/− in plating: 1, t = 7.164; df = 19; 2, t = 3.991, df = 19; 3, t = 0.7332, df = 13; 4, t = 5.489, df = 11; 5, t = 3.292, df = 11) i, Schematic summary of progenitor differentiation in Utx−/−. Green arrows, preferential differentiation; red lines, differentiation block. MPP, multipotent progenitors; LMPP, lymphoid primed multipotent progenitors. j, Kaplan–Meier survival curves of Utx−/Y and Utx+/Y compared with Utx−/−; P = nonsignificant between Utx−/Y and Utx+/Y by log-rank (Mantel–Cox) test, df = 1. k, Histopathological diagnoses of moribund mice. Numbers of mice with a cancer diagnosis and total number analyzed are indicated for each genotype. l, Schematic summary of progenitor differentiation in Utx−/Y. m,n, Serial replating (m) and proliferation (n) of Cas9-expressing HSPCs after Uty editing. Cells were isolated from n = 3 mice per genotype; the mean ± s.e.m. is shown; P by one-way ANOVA with Bonferroni correction (P shown for Cas9, Utx−/Y gRNA-Uty versus Cas9, Utx+/Y gRNA-Uty, in m for plating: 3 (t = 4.313, df = 8), 4 (t = 5.522, df = 8); in n for culture days: 4 (t = 3.176, df = 8); 6, (t = 3.994, df = 8); 7, (t = 4.537, df = 7). In c, d, f and g, the mean ± s.e.m. is shown; n, number of mice; P by two-sided t test. In b and h, mean ± s.e.m. is shown; P by one-way ANOVA with Bonferroni correction.

