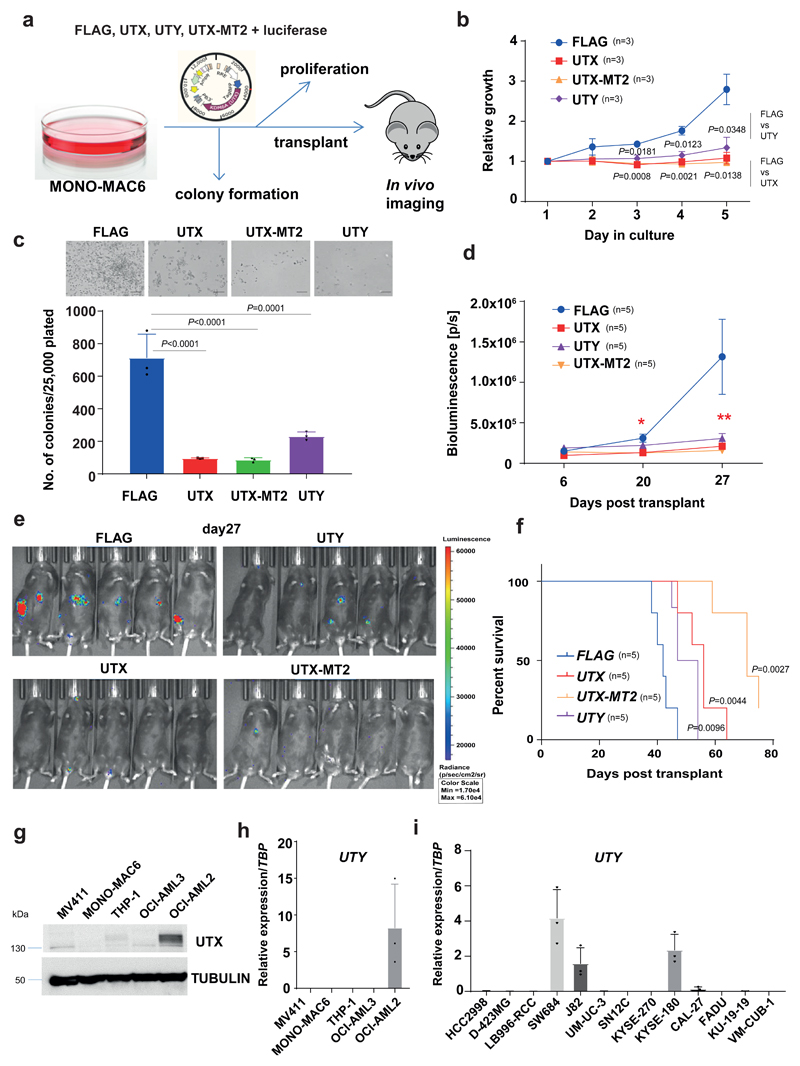
Figure 3. H3K27 demethylase activity is not required for tumor suppression by UTX.
a, Experimental approach for study of UTX-mutant MONO-MAC6 cells after expression of FLAG, UTX, UTY and UTX-MT2. b, UTX, UTY and UTX-MT2, as compared to FLAG, decreased MONO-MAC6 proliferation; mean ± s.e.m. is shown; n, number of independent cultures; P by one-way ANOVA with Bonferroni correction. Day 3 (compared to FLAG): UTX (t = 5,633; df = 8), UTY (t = 3,95; df = 8); day 4: UTX (t = 6.866; df = 8), UTY (t = 5.444; df = 8); day 5: UTX (t = 4.976; df = 8), UTY (t = 4.216; df = 8). c, Colony formation in semisolid medium. Top, similar result observed in n = 3 cultures; bottom, colony quantification. The mean ± s.e.m. is shown; n = 3 independent cultures; P by one-way ANOVA with Bonferroni correction; compared to FLAG: for UTX t = 10.19, df = 8; UTX-MT2 t = 10.36, df = 8; UTY t = 7.955; df = 8. d,e, In vivo growth after transplantation into immunocompromised mice. Cells were also transduced with luciferase-expressing vector, and mice were imaged on days 6, 20 and 27 after transplantation. d, Quantified bioluminescence, shown as mean ± s.e.m.; P by one-way ANOVA with Bonferroni correction: **P (FLAG versus UTX) = 0.0131, t = 3.317, df = 16; P (FLAG versus UTY) = 0.0242, t = 3.025, df = 16; P (FLAG versus UTX-MT2) = 0.0095, t = 3.469, df = 16; *P (FLAG versus UTX) = 0.0013, t = 4.408, df = 16; P (FLAG versus UTY) = 0.1284, t = 2.2, df = 16; for P (FLAG versus UTX-MT2) = 0.0010, t = 4.524; df = 16. e, Bioluminescence imaging of mice. f, Kaplan–Meier survival curves of transplanted mice; n, number of mice, P by log-rank (Mantel–Cox) test, reported versus FLAG, df = 1. g, Immunoblot analysis of UTX in AML lines; similar results were observed in n = 3 experiments. Uncropped images are shown in Supplementary Fig. 12. α-tubulin, loading control. h,i, qRT–PCR for UTY in AML (h) and in nonhematopoietic cancer cell lines with UTX mutations (i). In h and i, the mean ± s.e.m. is shown; n = 3 independent cell cultures.

