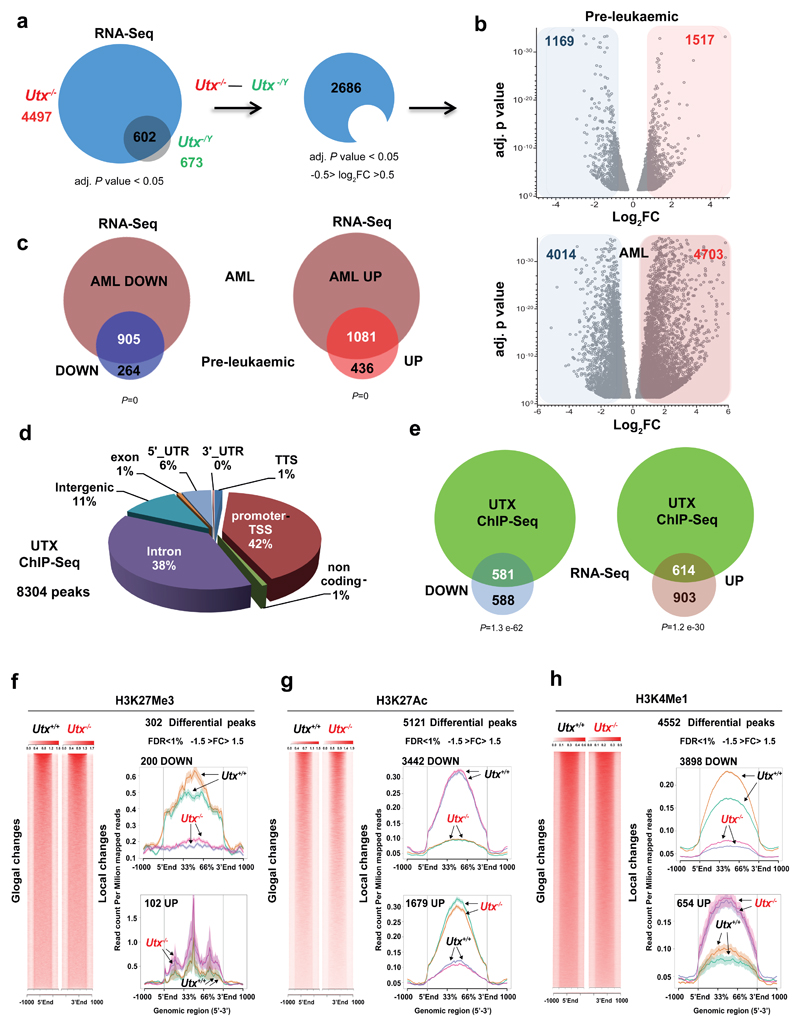
Figure 4. Utx loss drives both up and down regulation of gene expression primarily through effects on H3K27 acetylation.
a, Preleukemic gene expression changes in HSPCs from Utx−/− female (n = 2 mice) and Utx−/Y male (n = 2 mice) compared with sex-matched wild-type controls (n = 2 mice); genes with adjusted (adj.) P < 0.05 are shown. Subtraction of genes differentially expressed in males versus females defines a differential transcriptional program of interest; log2 fold change (FC) (–0.5 > log2 FC > 0.5). b, Volcano plot of log2 FC (–0.5 > log2 FC > 0.5) and adjusted P < 0.05 (only transcripts with P values between 0.05 and 1 × 10−38 are shown) for genes differentially expressed in the preleukemic and AML setting. In a and b, P values were generated with a negative binominal generalized linear model (DESeq2). c, Overlap between differentially expressed genes in Utx−/− preleukemic HSPCs (n = 2 mice) and AMLs (n = 3 mice), each compared to Utx+/+ HSPCs (n = 2 mice); P by hypergeometric test. Down, decreased genes or peaks; up, increased genes or peaks. d, Distribution of UTX ChIP–seq peaks in annotated regions of the genome. e, Highly significant enrichment of UTX-bound genes among those differentially expressed in preleukemic Utx−/− HSPCs; P by hypergeometric test. f–h, H3K27me3 (f), H3K27ac (g) and H3K4me1 (h) density plots (left) and average read counts (right) across all (global changes) or differentially modified regions (local changes). H3K27me3 signal density shows that only 302 genomic regions were differential modified, in contrast to similar plots revealing 5,120 differential modifications for H3K27ac and 4,552 differential modifications for H3K4me1 in Utx−/− versus Utx+/+ HSPCs. Arrows show each replicate (mouse) per genotype. False discovery rate (FDR) was calculated with the DiffBind tool; n = 2 mice per genotype. Plots are peak centered, scaled and ±1 kb for each locus. Shaded region in the line graphs in f–h indicate standard errors.

