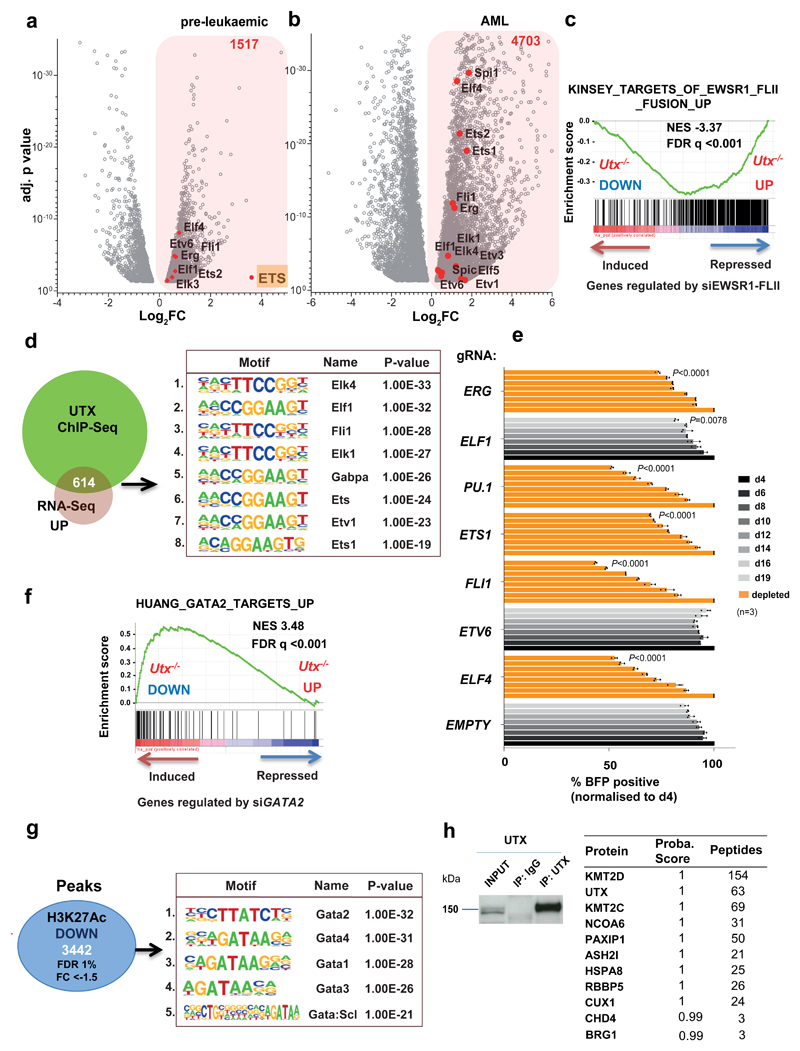
Figure 5. Utx loss activates an oncogenic ETS transcriptional program while suppressing a GATA program.
a,b, Volcano plots of differentially expressed genes in preleukemic (n = 2 mice) (a) and AML Utx−/− (n = 3 mice) (b) compared with wild-type controls (n = 2 mice), revealing overexpression of multiple ETS factors (red dots). FC (–0.5 < log2 FC > 0.5) and adjusted P < 0.05 (only transcripts with P values between 0.05 and 1 × 10−38 are shown in the graph); P values were generated in DESeq2. c, GSEA plot, showing significant overlap with a known ETS oncogenic program driven by the EWSR1–FLI1 fusion. The ‘si’ prefix denotes short interfering RNA. The Kinsey data are from the GSEA database (URLs). d, Motif analysis of UTX ChIP–seq peaks that overlap with overexpressed genes; number indicates motif rank. e, MONO-MAC6 proliferation after editing of the indicated gene. The BFP-positive fraction was compared with the nontransduced population and normalized to day 4 for each gRNA. The mean ± s.d. is shown; n, number of independent cell cultures; P by one-way ANOVA with Bonferroni correction; P shown for day 19 compared with control gRNA (empty) for: ELF4 (t = 32.32), ETV6 (t = 10.03), FLI1 (t = 41.1), ETS1 (t = 15.85), SPI1 (t = 33.56), ELF1 (t = 3.967) and ERG (t = 12.35); df = 16. f, GSEA plot showing enrichment of genes differentially expressed in Utx−/− HSPCs with a published dataset of GATA2 targets. g, Motif analysis of 3,442 downregulated H3K27ac peaks (FDR < 1%, FC < –1.5) identified in Utx−/− HSPCs; number indicates motif rank. The Huang data are from the GSEA database (URLs). h, Selected proteins identified by mass spectrometry after immunoprecipitation of endogenous UTX from mouse myeloid cells (416B) (n = 2 independent cell cultures). Motif and statistical analysis in d and g were determined in HOMER software (Methods and Supplementary Table 30).

