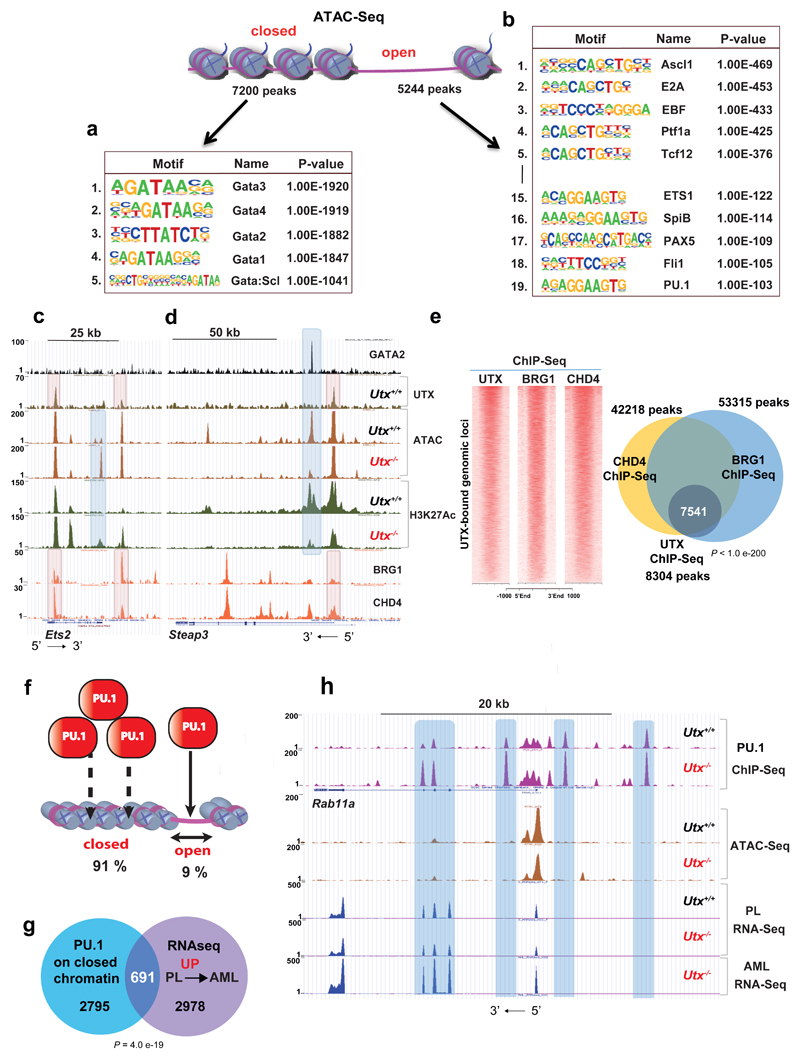
Figure 6. UTX interacts with chromatin modifiers to maintain chromatin accessibility.
a,b, Motif analysis of ATAC–seq closed (a) and open (b) peaks, revealing dramatic enrichment in GATA motifs in the former and ETS, among other motifs, in the latter. Number indicates motif rank. Motif and statistical analysis was performed in HOMER software (Supplementary Table 30). c,d, Genomic snapshot of GATA2, UTX, ATAC–seq and H3K27ac ChIP–seq in Utx+/+ and Utx−/− HSPCs at the Ets2 (c) and Steap3 loci (d). Colocalization of GATA2 binding with dynamically closed chromatin and loss of H3K27ac after UTX loss were found without evidence of GATA2-UTX cobinding. In contrast, binding of the chromatin remodelers SMARCA4 and CHD4 directly colocalized with UTX binding (lower two tracks). At the Ets2 locus, newly accessible chromatin was also seen after UTX loss, again at regions not directly bound by UTX or chromatin remodelers. e, Density plots of UTX, SMARCA4 and CHD4 ChIP–seq on UTX-bound genomic loci; Venn diagram shows overlap among all UTX, SMARCA4 and CHD4 ChIP–seq peaks; P by Fisher's exact test for ChIP–seq: UTX versus SMARCA4/CHD4. f, Schematic representation of PU.1 occupancy occurring mostly on closed chromatin. g, Overlap of genes associated with enhanced PU.1 binding (in Utx−/−) on closed chromatin with gene expression changes from preleukemia (PL) to AML. For PU.1 ChIP–seq, n = 3 mice; ATAC–seq, n = 3 mice; PL RNA-seq, n = 2 mice; AML RNA-seq, n = 3 mice. P by hypergeometric test. h, Genomic snapshot demonstrating an enhanced PU.1 occupancy in Utx−/− HSPCs that occurs on closed chromatin at the Rab11a locus and a correlation with PL and AML RNA-seq. Rab11a expression increased only after progression to AML.

