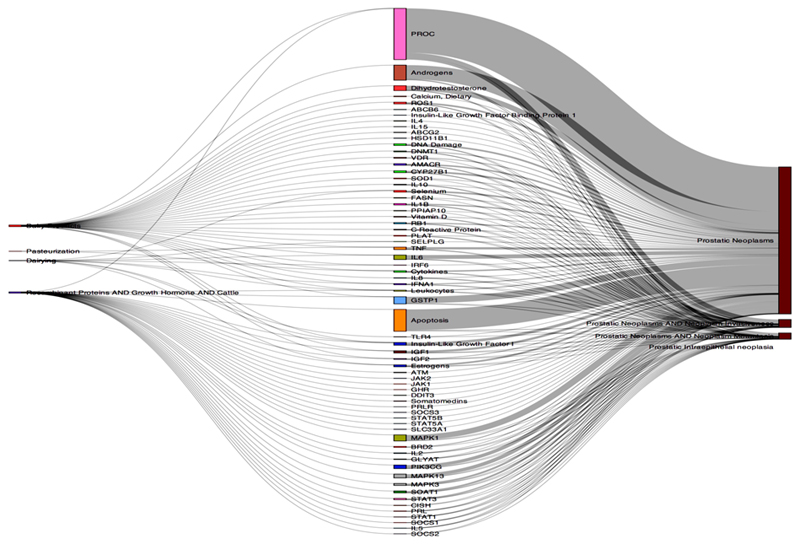
Figure 2.
A Sankey plot of milk-IGF-prostate cancer
Figure 2 shows a Sankey plot which indicates visually the quantity of evidence linking exposure to different intermediate phenotypes and the quantity of evidence linking the same intermediate phenotypes to outcome. This particular Sankey plot shows the quantity of evidence for milk and IGF on the left hand side and the quantity of evidence for IGF-prostate cancer on the right hand side of the plot.

