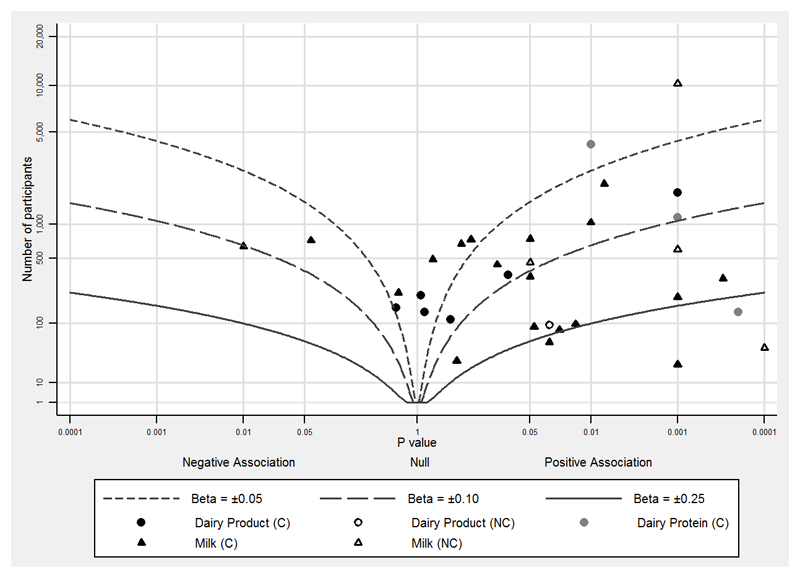
Figure 4.
Albatross plot of milk, dairy products and dairy proteins (exposures) and IGF-I (outcome).
Figure 4 shows that the majority of studies are on the right side of the graph, indicating a positive association of exposure with outcome. Note also that the majority of studies showing an association do so around a standardised beta coefficient (Beta) of 0.1, which is a 0.1 standard deviation increase in outcome for a 1 standard deviation increase in exposure.

