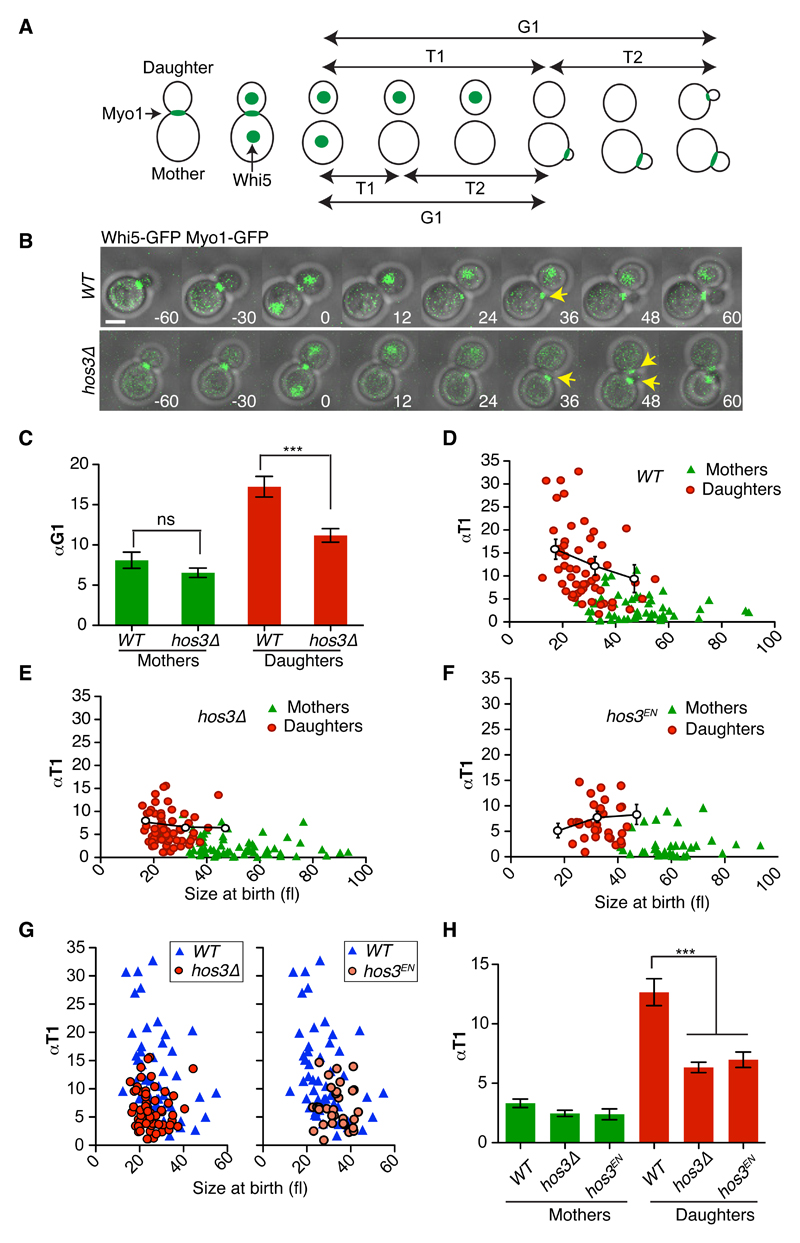
Figure 1. Hos3 delays Start in daughter cells.
(A) Scheme showing the separation of G1 in two distinct periods, T1 and T2, relative to Myo1 and Whi5 dynamics. The disappearance of Myo1-GFP from the bud neck marked cytokinesis; its reappearance to the new bud site marked budding. (B) Composite of phase contrast, Whi5-GFP and Myo1-GFP in wild type (WT) and hos3Δ cells. Daughter hos3Δ cells start a new bud (Myo1-GFP appearance, arrows) earlier than WT. Confocal sections spanning the entire cell were acquired at 3-minute intervals. Time is indicated in minutes; t=0 marks the last frame before cytokinesis. Scale bars, 2 μm. Experiments were repeated three times with similar results. (C-G) αTG1 values (mean and SEM) (C) and correlation between αT1 (with binned means and SEM) and cell size at the time of birth (cytokinesis) (D-G), for mother and daughter cell pairs. (H) αT1 values (mean and SEM) are shown in cells of the indicated strains. Sample size: WT (n=110 cells), hos3Δ (n=128 cells) and hos3EN (n=66 cells) pooled from three independent experiments. In panels C and H, two-sided Mann-Whitney test were used. *** denotes p < 0.0001; ns, non-significant, p > 0.05. Exact p values: 8.93x10⁻⁵ (Figure 1C, WT vs. hos3Δ), 7.20x10⁻⁷ (1H, WT vs. hos3Δ), 5.69x10⁻⁴ (1H, WT vs. hos3EN).

