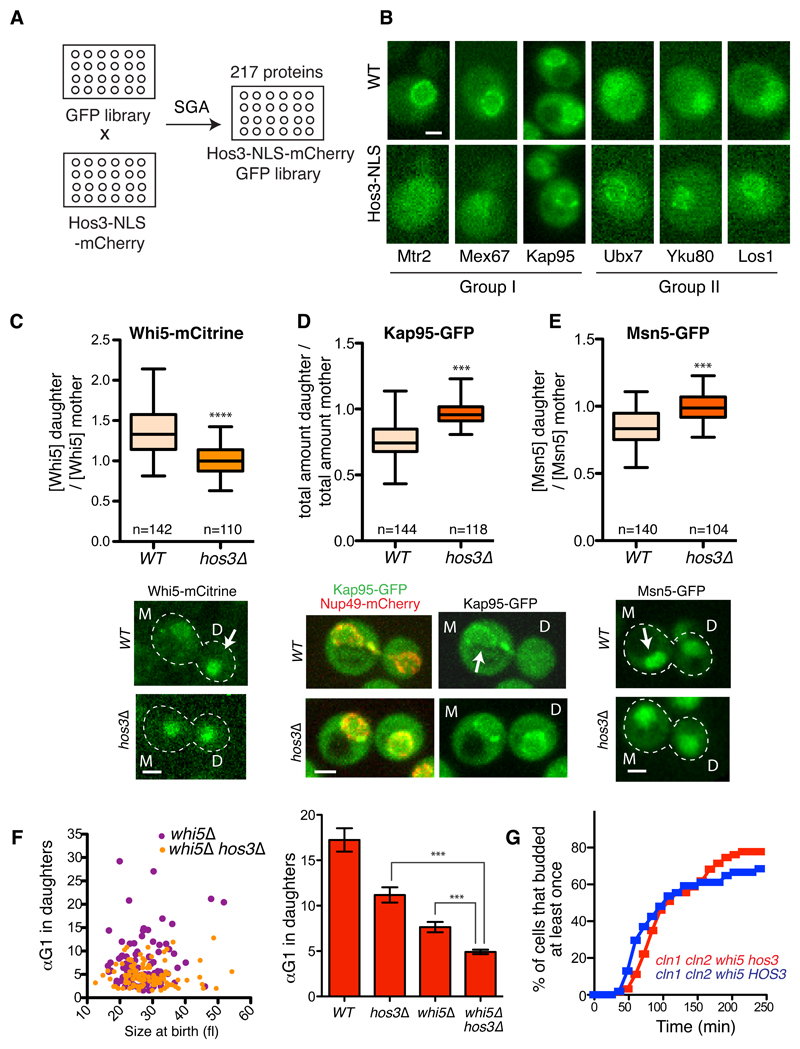
Figure 5. Hos3 modulates localization of perinuclear factors and controls the asymmetry of Whi5 and karyopherins.
(A) Construction of a library of nuclear GFP-fusion proteins expressing Hos3 or Hos3-NLS. (B) Examples of protein localization changes induced by Hos3-NLS. Group I proteins are displaced away from the nuclear periphery, whereas group II proteins are enriched at the same location in the presence of Hos3-NLS. These experiments were repeated three times with similar results. (C-E) Hos3 affects asymmetric distribution of Whi5, Kap95 and Msn5. Nuclear fluorescence was measured in mother and daughter cells at the time of birth. Boxes include 50% of data points, the line represents the median and whiskers extend to maximum and minimum values. ***, p < 0.001, two-sided Mann-Whitney test. Exact p values: 10-15 (Whi5), 10-15 (Kap95), 2.8x10⁻¹⁰ (Msn5). Arrows indicate increased protein accumulation in mother or daughter cells. (F) Correlation between αTG1 and cell size at the time of birth (cytokinesis), for mother and daughter cell pairs (left); and αTG1 (mean and SEM) (right) in whi5Δ (n=178 cells) and whi5Δ hos3Δ (204 cells). WT (n=110 cells) and hos3Δ (n=128 cells) from Figure 1 are included for comparison. *** p < 0.001, two-sided Mann-Whitney test. Exact p values: 10-13 (hos3 vs hos3 whi5); 4.53x10⁻⁵ (whi5 vs hos3 whi5). Note that TG1 was used to measure Start instead of T1, since the latter is defined by Whi5 nuclear exit. Scale bars, 2 μm. (G) Frequency of budding in cells of the indicated strains, determined by time-lapse microscopy as in Figure 1. Daughter cells; cln1Δcln2Δwhi5Δ (n=63 cells), cln1Δcln2Δwhi5Δhos3Δ (n=54 cells).

