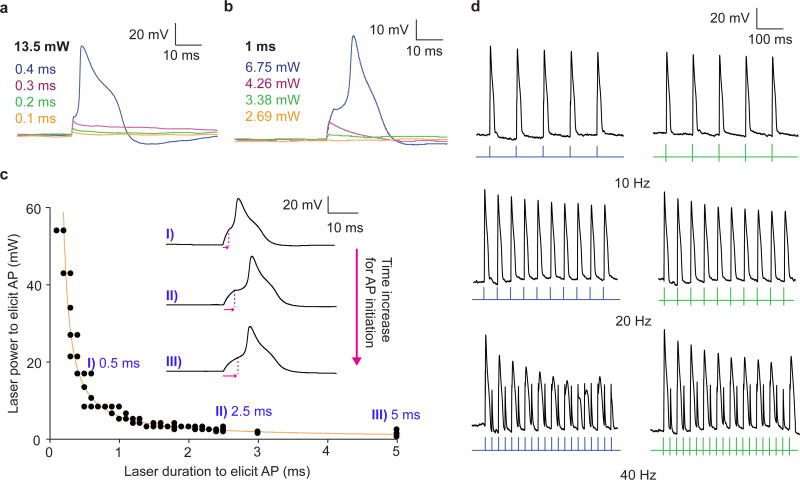
Figure 4. Photocurrent generated by coaxial nanowires can be harnessed to elicit action potentials in primary rat dorsal root ganglion neurons.
(a and b) Patch clamp electrophysiology current clamp traces of membrane voltage in DRG neurons illuminated by a 532 nm laser pulse at the neuron/PIN-SiNW interface at (a) 13.5 mW with durations of 0.1 ms (orange), 0.2 ms (green), 0.3 ms (pink), and 0.4 ms (blue) and (b) 2.69 mW (orange), 3.38 mW (green), 4.26 mW (pink), and 6.75 mW (blue) for 1 ms. These traces in (a) and (b) are representative traces from one of a total of 1398 traces from 30 independent neurons, many of which are sub-threshold depolarizations at various laser powers and durations. 173 traces out of the 1398 represent action potentials. (c) Excitability curve displaying 532 nm laser power and duration combinations that produce APs in neurons (N=6 neurons; total of N=78 replicates) interacting with a single PIN-SiNWs with specific traces and time to peak response for each of those traces (pink arrows) at I) 0.5 ms, II) 2.5 ms, and III) 5 ms durations highlighted. Error bars represent the standard error about the average. Some of the data points are overlaid. (d) AP traces from neurons interacting with single PIN-SiNWs pulsed at 10, 20 and 40 Hz with light (green bars) and injected current from patch amplifier (blue pulses). These are representative traces from a total of 6 pulse train traces for each frequency taken from 3 independent neurons.

