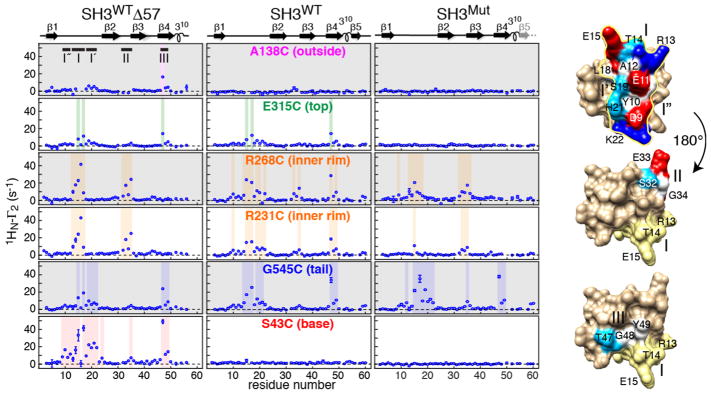
Figure 2.
Intermolecular PRE (1HN–Γ2) profiles observed on 15N-labeled SH3WTΔ57 (left panels), SH3WT (middle panels), and SH3Mut (right panels) in the presence of GroEL paramagnetically labeled with EDTA–Mn2+ at six cysteine engineered sites. Regions with 1HN-Γ2 > 5 s−1 are shaded. The secondary structure is shown above the panels. PREs are measured using a 1H–15N correlation-based experiment21 as the difference in corresponding 1HN-R2 values between paramagnetic and diamagnetic reference samples. Data were recorded at 800 MHz and 10 °C on samples containing 100 μM 15N-labeled SH3 and 100 μM (in subunits) GroEL. The locations of sites I/I′/I″ (top), II (middle), and III (bottom) on the molecular surface of SH3WTΔ57 are shown on the right, with residues color coded as in Figure 1. In the views for sites II and III (rotated by 180° relative to the top view), site I is shown in yellow.

