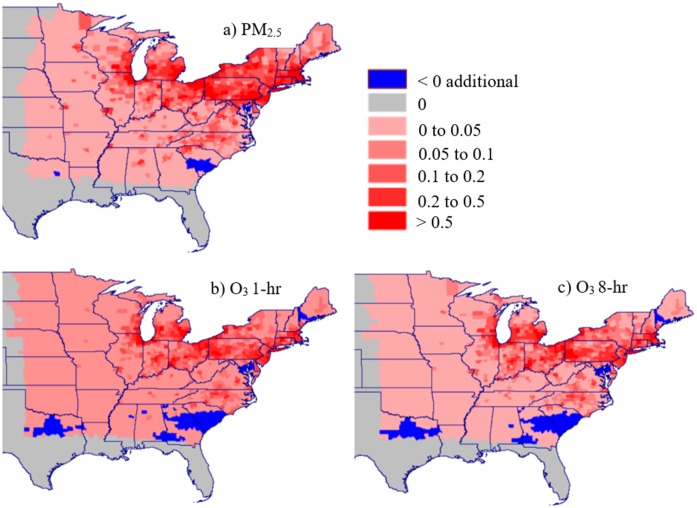
Fig 7. The mortality impacts of adaptation due to air pollution.
Shown is the air-pollution-related mortality increase due to adaptation (the mid-century adaptation scenario minus the mid-century climate-only scenario) for (a) PM2.5 as taken from the Expert F concentration–response function (the median function), (b) O3 based on Levy et al. [97] using maximum daily 1-hour concentrations, and (c) O3 based on Levy et al. [97] using maximum daily 8-hour average concentrations.

