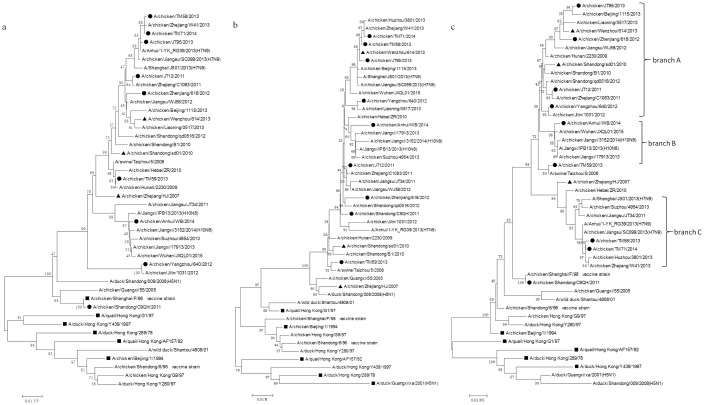
Fig 3. Phylogenetic trees for NP, M and NS genes collected from mainland China between 2011 and 2014.
Solid squares indicate representative strains, solid circles indicate the strains isolated in this study (black circles indicate representative isolates which emerge in the phylogenetic trees for all of the genes except for HA, and white circles indicate the remaining 28 isolates in this study which only emerge in the HA phylogenetic tree), and solid triangles indicate G57 representative strains. Unrooted phylogenetic trees were generated by the distance-based neighbor-joining method using the MEGA6.0 software suite (for the following nucleotide positions: a) NP, 35–1456; b) M, 56–960; c) NS, 75–800). The percentage of replicate trees in which the associated taxa clustered together in the bootstrap test with 1000 replicates is shown next to the branches.

