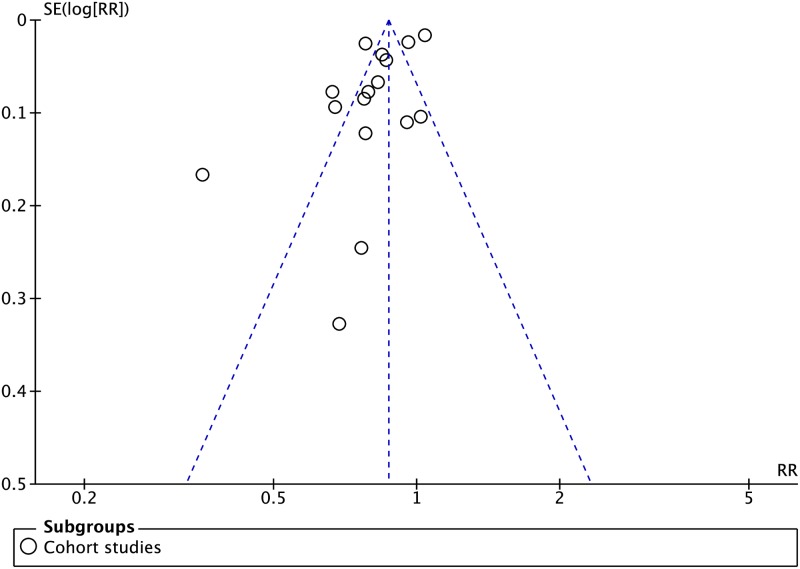
Fig 3. Funnel plot of cohort studies comparing treatment success rates in patients undergoing SAT versus DOT. No funnel plot of RCTs has been included as there were fewer than 10 RCTs.
DOT, directly observed therapy; RCT, randomized controlled trial; RR, risk ratio; SAT, self-administered therapy; SE, standard error.

