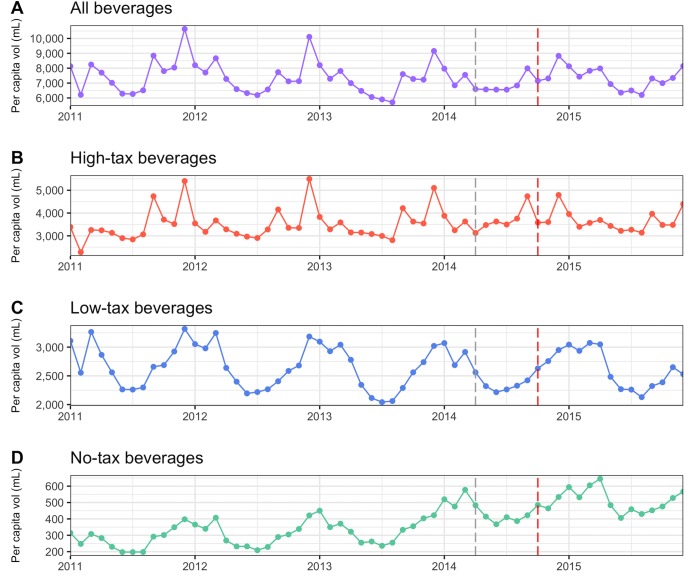
Fig 1. Volume (mL) of soft drink products purchased from January 2011 to December 2015.
(A) All beverages, (B) high-tax products, (C) low-tax category, (D) no-tax category. Aggregated mean volume of soft drinks purchased from January 2011 to December 2015. The grey vertical dotted line in the figure refers to the announcement of the IABA tax policy in March 2014, whereas the red vertical dotted line is for the implementation of the policy in October 2014. Source: authors’ analysis of the Kantar WorldPanel data for urban households in Chile. IABA, Impuesto Adicional a las Bebidas Analcohólicas.

