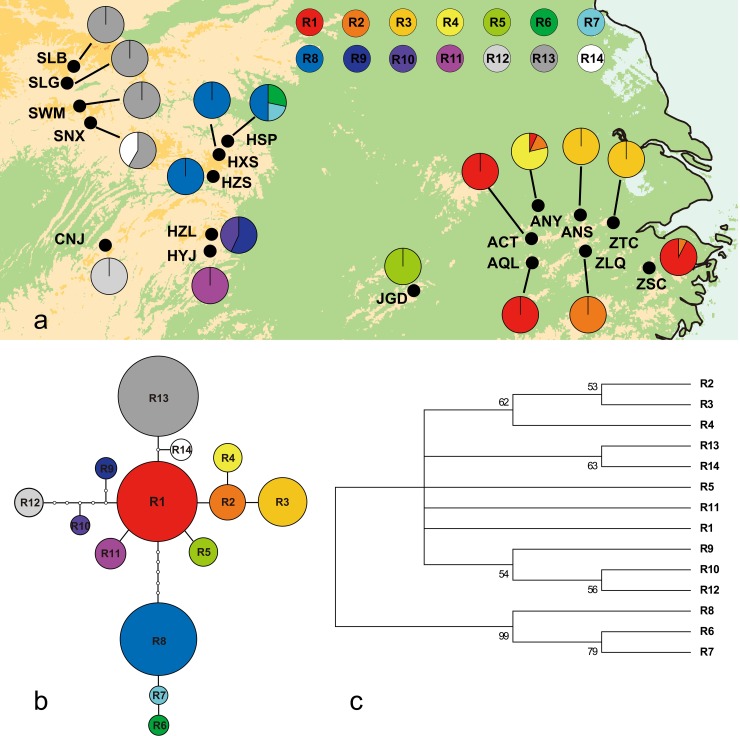
Fig 2.
(a) Distribution of 14 Ribotypes in B. clarkeana. (b) TCS-derived Network of 14 Ribotypes of B. clarkeana. Small open circles indicate mutational steps. Circle sizes represent sample sizes (n). (c) 50% Majority-Rule Consensus Neighbor-Joining Tree Obtained via the Analysis of 14 Ribotypes of B. clarkeana. Based on 1000 permutations, bootstrap values higher than 50% are indicated above branches.

