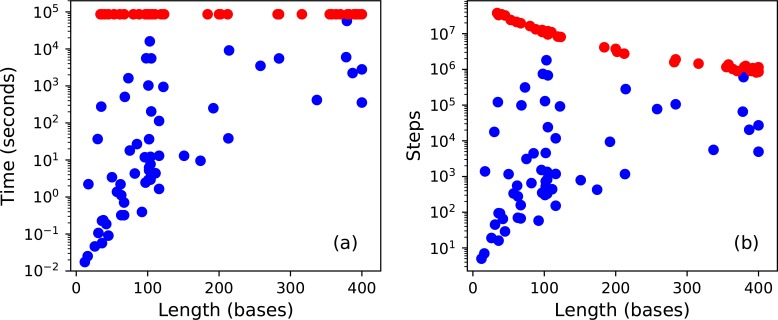
Fig 2.
Difficulty of solving puzzles as measured by (a) clock time or (b) steps, versus sequence length. Blue dots represent the 58 puzzles that were successfully solved on the first attempt. Red dots represent the 42 puzzles on which it gave up after running for 24 hours. (Two more of them were eventually solved on later attempts.) Longer sequences take more time per step, so fewer steps can be completed in 24 hours.

