
Figure 13.
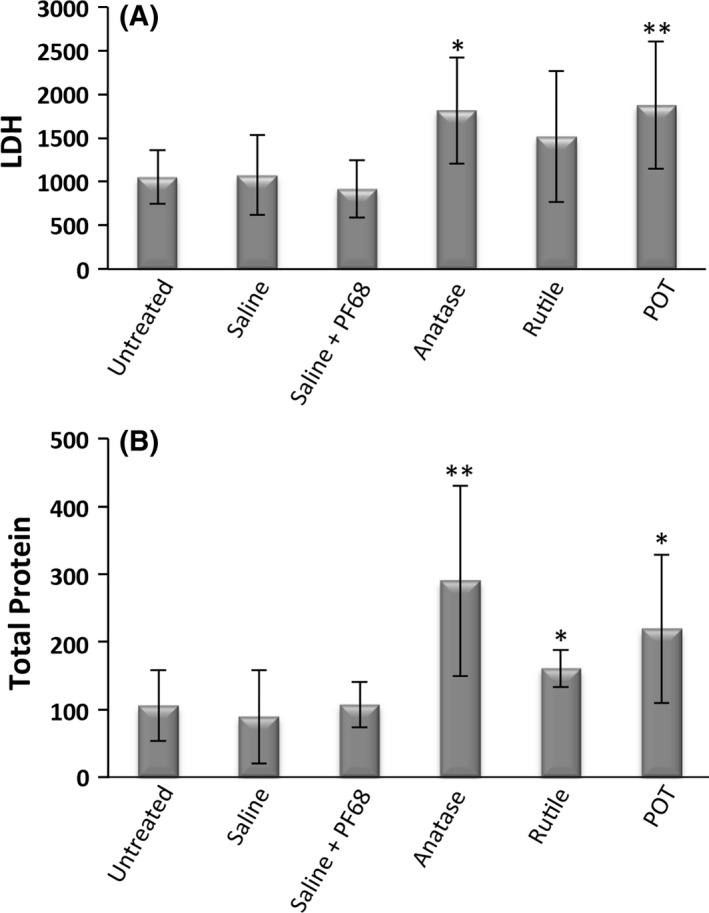
Biochemical analysis of pleural cavity lavage fluid. A, Lactate dehydrogenase (LDH) enzyme activity, measured as micro‐units/L and B, total protein concentration (μg/mL). *P < .05 and **P < .01 vs vehicle (photoreactive anatase [a‐nTiO 2] and inert rutile [r‐nTiO 2] vs saline; potassium octatitanate [POT] vs saline + PF68) 4 wks after the final trans‐tracheal intrapulmonary spraying dose