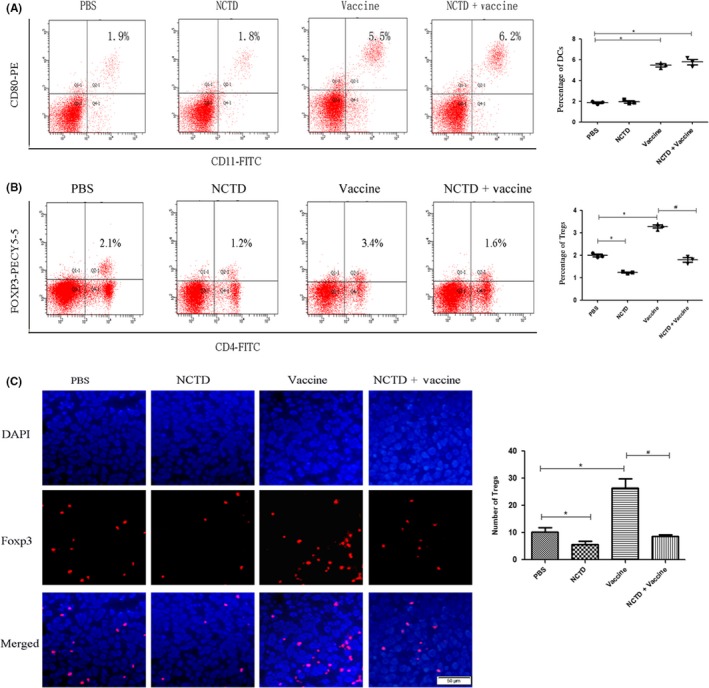
Figure 5.

Proportion of mature dendritic cells (DCs) and regulatory T cells (Tregs) in mice after combination therapy with norcantharidin (NCTD) and vaccine. A, To detect the mature DCs, blood samples were collected from each treatment group on day 30 after tumor cell injection. Cells were stained with FITC‐labeled anti‐mCD11c and phycoerythrin (PE)‐labeled anti‐mCD80 antibodies, and measured by flow cytometry. B, Blood samples were collected from mice on day 30 after tumor cell injection and stained with FITC‐labeled anti‐mCD4 and Pecy5.5‐labeled anti‐mFoxp3 antibodies. C, Tumor tissues were collected from each group. Tregs were detected by immunofluorescence (red) (magnification, ×200). All experiments were repeated at least three times. *P < .05 vs PBS; # P < .05 vs Vaccine
