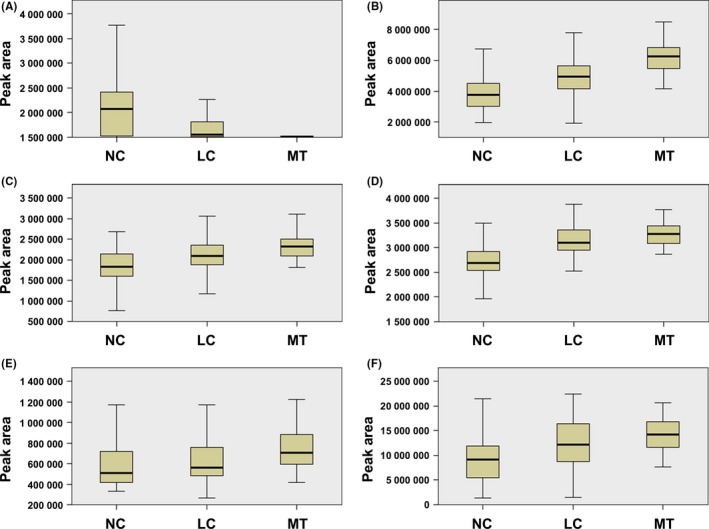
Figure 4.

Boxplots of the differential metabolites associated with breast cancer progression. A, Boxplot showing progressive reduction of 9‐cis‐retinoic acid during progression from NC to LC to MT (NC vs LC: P = 2.349E‐5; LC vs MT: P = .00363; NC vs MT: P = 3.109E‐11). B, Boxplot showing progressive elevation of l‐dihydroorotic acid during progression from NC to LC to MT (NC vs LC: P = 2.793E‐5; LC vs MT: P = 1.571E‐6; NC vs MT: P = 1.767E‐11). C, Same as (B) but for sphingomyelin (SM)(d18:0/16:1(9Z)) (NC vs LC: P = .00488; LC vs MT: P = .01190; NC vs MT: P = 5.084E‐7). D, Same as (B) but for lysophosphatidic acid (LPA)(18:1(9Z)/0:0) (NC vs LC: P = 5.212E‐6; LC vs MT: P = 3.442E‐6; NC vs MT: P = 6.802E‐13). E, same as (B) but for sphinganine (NC vs LC: P = .04155; LC vs MT: P = .01973; NC vs MT: P = .00016). F, Same as (B) but for lysophosphatidylcholine (lysoPC)(0:0/18:0) (NC vs LC: P = .00625; LC vs MT: P = .03518; NC vs MT: P = 2.502E‐7). LC, localized breast cancer serum sample; MT, metastatic breast cancer serum sample; NC, normal control sample
