
Figure 2.
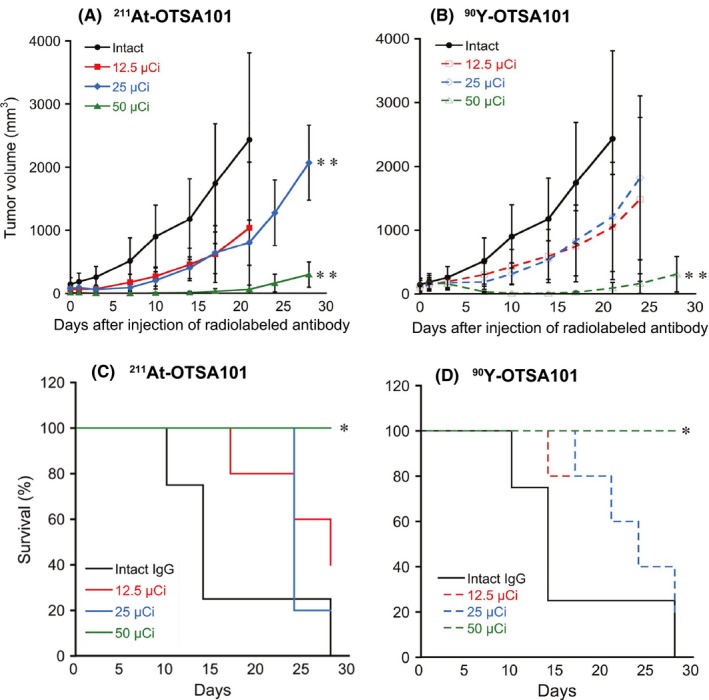
Therapeutic results of radioimmunotherapy (RIT) with 211At‐OTSA101 and 90Y‐OTSA101 in the synovial sarcoma (SS) subcutaneous xenograft mouse model. Changes in tumor volumes in the model mice after RIT with 211At‐OTSA101 (A) and 90Y‐OTSA101 (B) are shown. Plots were interrupted if the animal reached the defined endpoint. Kaplan‐Meier survival curves of mice after RIT with 211At‐OTSA101 (C) and 90Y‐OTSA101 (D). Five mice were enrolled in each of the treatment groups, except for the intact IgG control (4 mice). *P < .05, **P < .01, vs intact IgG control