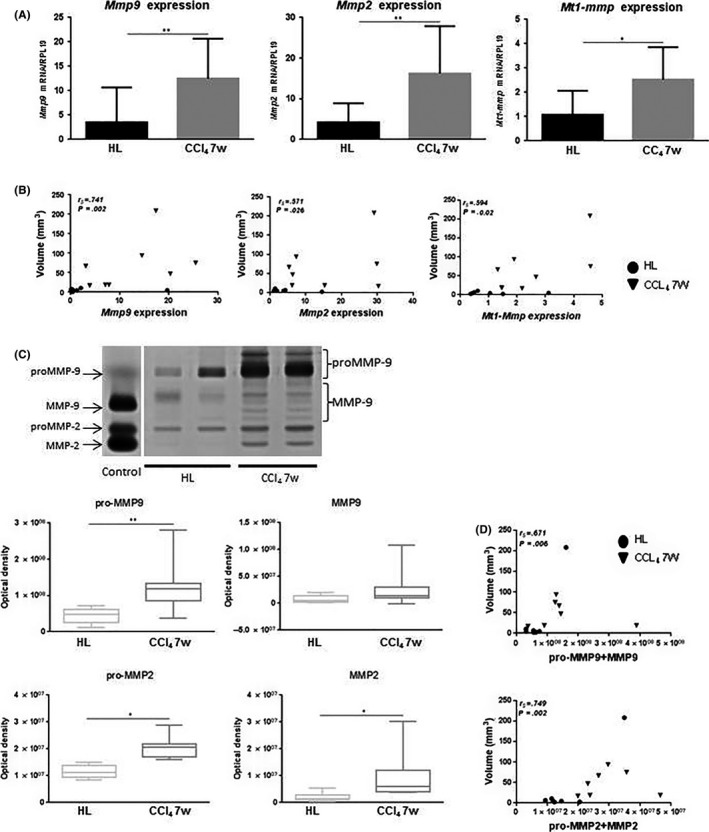
Figure 4.

A, Tumor gene expression (mean ± SD) of Mmp9, ‐2 and membrane type 1 metalloproteinase (Mt1‐mmp). B, Correlation between tumor volume (mm3) and Mmp9, ‐2 and Mt1‐mmp mRNA expression (circles for HL data and inverted triangles for the carbon tetrachloride [CCl4] 7w group). Spearman rank correlation coefficient is indicated as r s. C, Zymogram showing latent and active forms of MMP‐2 and MMP‐9 in the tumors. MMP activities were quantified by gel densitometry. Three bands and 5 bands were considered for proMMP‐9 and MMP‐9, respectively. Only 1 zymolytic band was detected for proMMP‐2 and MMP‐2. D, Correlation between tumor volume (mm3) and the sum of the latent and active forms of MMP‐9 and MMP‐2 (circles for HL data and inverted triangles for the CCl4 7w group). Spearman rank correlation coefficient is indicated as r s. *P < .05; **P < .01. CCl4 7w, mice pretreated with CCl4 for 7 wk; HL, healthy liver group
