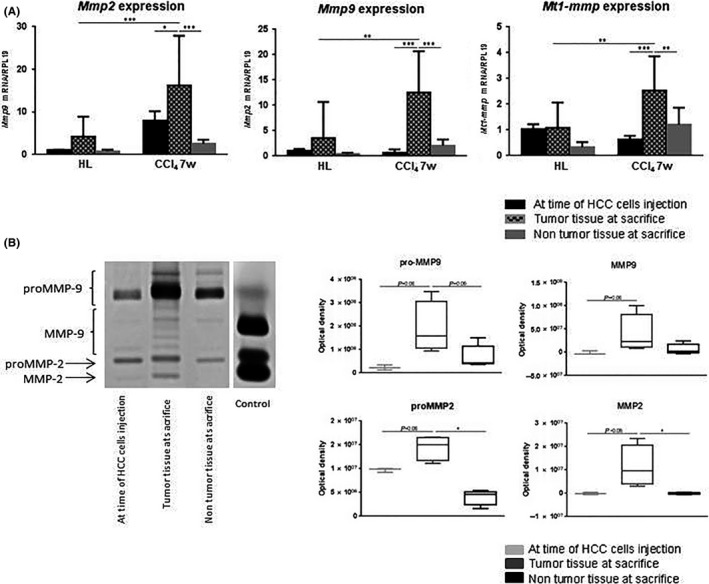
Figure 5.

A, Gene expression of Mmp9, ‐2 and membrane type 1 metalloproteinase (Mt1‐mmp) (mean ± SD) at the time of hepatocellular carcinoma (HCC) cell injection (black bars), inside the tumor at time of death (grid pattern bars), and in the adjacent non‐tumor parenchyma at time of death (grey bars). B, Zymogram showing latent and active forms of MMP‐2 and MMP‐9 at the time of HCC cell injection (light grey box in the quantification), inside the tumor at time of death (dark grey box in the quantification), and in the non‐tumor parenchyma at time of death (black box in the quantification). *P < .05. Carbon tetrachloride (CCl4) 7w, mice pretreated with CCl4 for 7 wk; HL, healthy liver group
