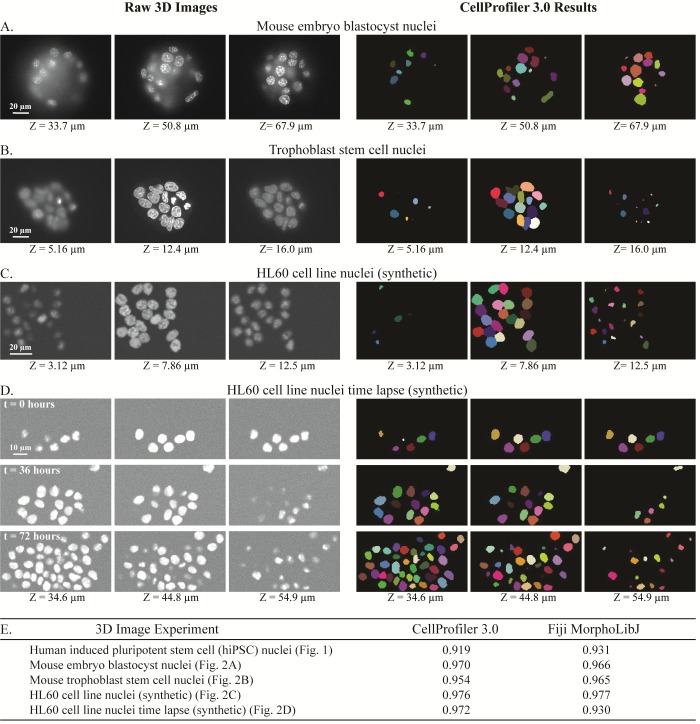
Fig 2. Examples of 3D image segmentation produced by CellProfiler 3.0, across two experimental systems and two sets of synthesized images.
Three focal planes shown for each. Raw images (left) and CellProfiler outputs (right) showing nuclei of mouse embryo blastocyst (A), mouse trophoblast stem cells (B), and synthetic images of HL60 cell lines (C) and (D). More information about segmentation steps used for these images can be found in S2–S5 Figs. (E) Comparison of the segmentation accuracy of CellProfiler 3.0 and Fiji’s plugin MorphoLibJ, based on the Rand index of the processed image and its ground truth (out of a total of 1.0). Object accuracy comparisons of these same images may be found in S6 Fig and S3 File. 3D, three-dimensional; hiPSC, human induced pluripotent stem cell.

