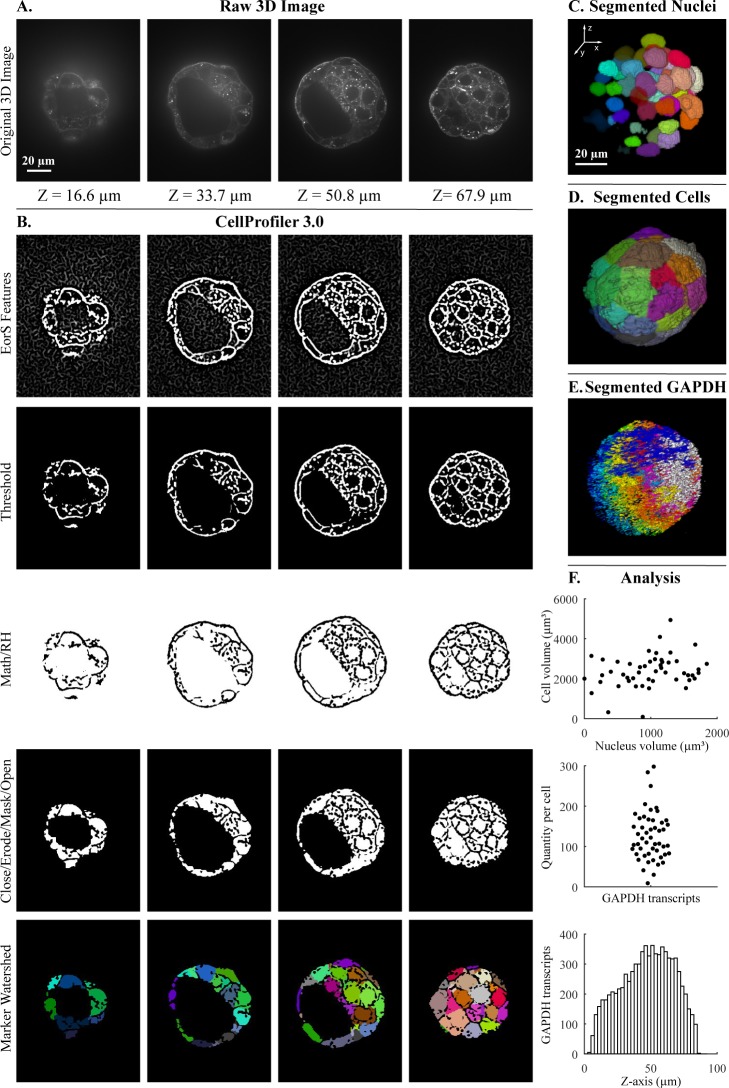
Fig 3. Segmentation steps for the quantification of transcripts per cell within a 3D blastocyst.
Images were captured of a mouse embryo blastocyst cell membrane stained with WGA and FISH for GAPDH transcripts. (A) Original 3D image of blastocyst cell membrane prior to analysis. (B) CellProfiler 3.0 image processing modules used for membrane image processing. Figure labels: RH (“RemoveHoles”), Close (“Closing”), Erode (“Erosion”), Mask (“MaskImage”), Math (“ImageMath”), EorS Features (“EnhanceOrSuppressFeatures”). (C) Nuclei after segmentation by CellProfiler, as viewed in Fiji. (D) Segmentation of cells after setting nuclei as seeds by CellProfiler, as viewed in Fiji. (E) Segmentation of GAPDH transcript foci using CellProfiler, as viewed in Fiji. (F) Examples of analysis that can be done by CellProfiler: (top) cell volume relative nucleus volume, (middle) GAPDH transcript quantity in each cell using CellProfiler’s “RelateObjects” module, (bottom) number of GAPDH transcripts in Z-plane (bin size = 2.5 μm). The underlying measurements may be downloaded as S1 File. Images were provided by Javier Frias Aldeguer and Nicolas Rivron from Hubrecht Institute, Netherlands, and are available from the Broad Bioimage Benchmark Collection (https://data.broadinstitute.org/bbbc/BBBC032/). 3D, three-dimensional; FISH, fluorescent in situ hybridization; GAPDH, glyceraldehyde 3-phosphate dehydrogenase; WGA, wheat germ agglutinin.

