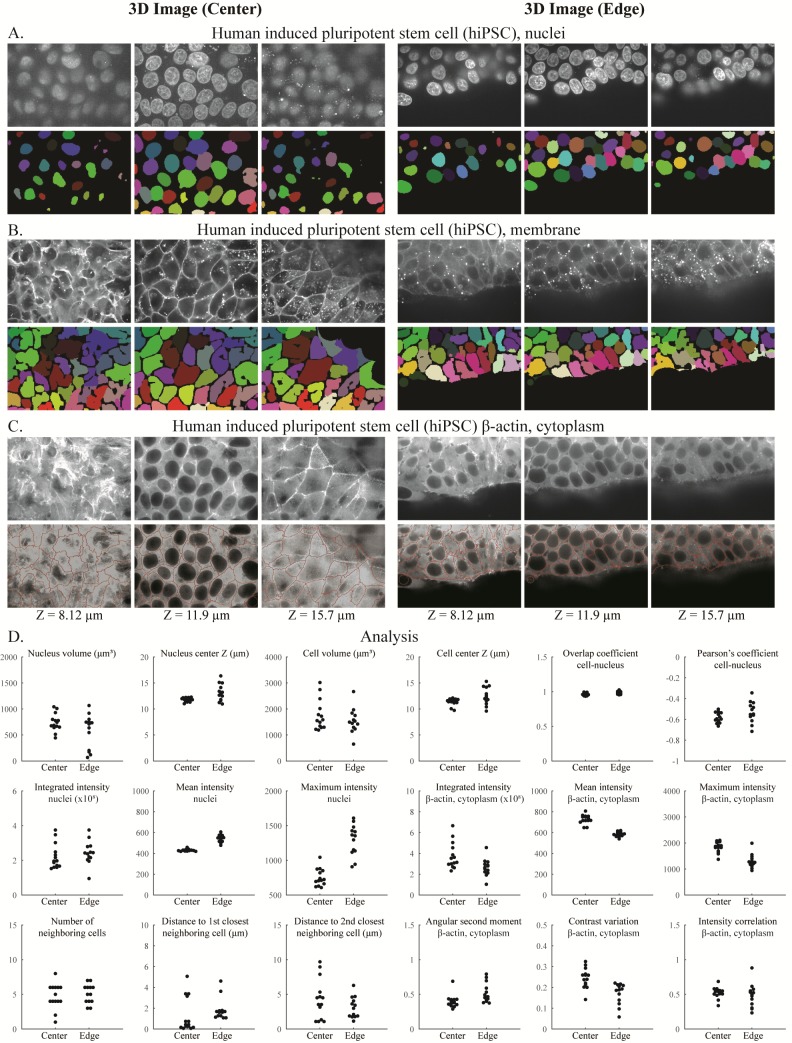
Fig 4. Segmentation and analysis of 3D hiPSC images using CellProfiler 3.0.
DNA channel showing nuclei (A), CellMaskDeepRed channel showing membrane (B), and GFP channel showing beta-actin (C) at the center (left) and edge (right) of the hiPSC colony. (D) Various measurements obtained from the samples are shown; note that cells touching the edge of each image are excluded from this analysis. The underlying measurements may be downloaded as S2 File. Images are from the Allen Institute for Cell Science, Seattle, and are available from the Broad Bioimage Benchmark Collection (https://data.broadinstitute.org/bbbc/BBBC034/). 3D, three-dimensional; GFP, green fluorescent protein; hiPSC, human induced pluripotent stem cell.

