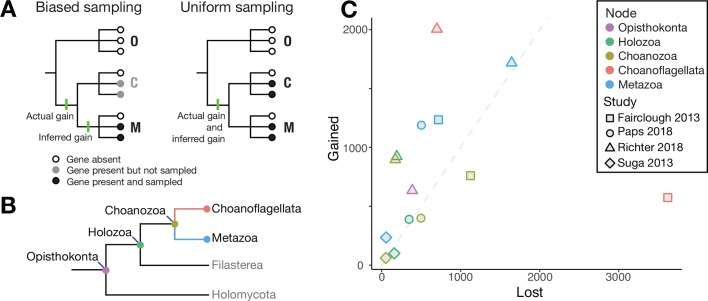
Figure 1. Genes lost and gained.
(A) Example of biased sampling (left): although a gene was gained (first green line) before group C and group M diverged, biased sampling means that it is only detected in group M, which leads to the incorrect inference (second green line) that the gene arose after the groups diverged. With uniform sampling (right), the gene gain is correctly inferred (third green line). Groups C, M and O could be Choanoflagellata, Metazoa and Outgroups. (B) Cladogram showing the evolutionary relationships of the clades in question, with the Choanoflagellata stem shown in red and the Metazoa stem shown in blue. Choanozoa refers to the clade Choanoflagellata + Metazoa (Brunet and King, 2017). (C) The number of gene groups gained (y-axis) plotted against the number of gene groups lost (x-axis) along various branches leading to the nodes shown in panel B, based on the data in four studies (Fairclough et al., 2013; Paps and Holland, 2018; Richter et al., 2018; Suga et al., 2013). The gray dashed line indicates equal gene group gain and loss. Note that the four studies use different methodologies to define groupings of genes. Data and analyses are available at https://github.com/dunnlab/gene_inventory_2018 (Lewis and Dunn, 2018; copy archived at https://github.com/elifesciences-publications/gene_inventory_2018).

