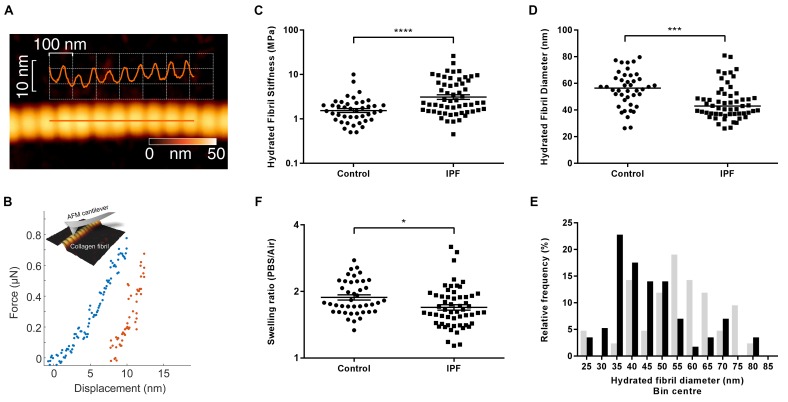
Figure 4. Collagen fibrils from IPF tissue have altered fibril diameter and stiffness.
(A) Atomic force microscopy (AFM) height topography image of a collagen fibril and corresponding height topography long axis profile showing characteristic D-periodicity (~67 nm). (B) Force displacement curve (blue: loading, red: unloading) of an individual fibril tested using AFM cantilever-based nanoindentation. (C) Indentation modulus of collagen fibrils (3–7 fibrils per donor) from control (n = 42 fibrils from eight donors) or IPF lung tissue (n = 57 fibrils from 10 donors) under hydrated conditions; each data point represents the mean of 30 to 50 force-displacement curves per fibril. Bars are mean ±s.e.m of log transformed data. ****p<0.0001 by Student’s t-test with Welch’s correction for unequal variances of log transformed data (two-tailed). (D) Fibril diameter as determined by measurement of fibril height under hydrated conditions. Bars are median; ***p<0.001 by Mann-Whitney t-test (two-tailed). (E) Frequency distribution of hydrated collagen fibril diameters measured for control (light grey bars) and IPF lung tissue (black bars). (F) Fibril swelling as determined by the ratio of the diameters under hydrated and dry conditions. Bars are mean ±s.e.m of log transformed data. *p<0.05 by Student’s t-test of log transformed data (two-tailed).

