. 2018 Jun 18;7:e34789. doi: 10.7554/eLife.34789

Figure 1. Virtual reality setup and behavior within it.

(A) Schematic of the VR setup (VR square). (B) A rotating head-holder. (C) A mouse attached to the head-holder. (D–E) Side views of the VR environment. (F–G) Average running speeds of all trained mice (n = 11) across training trials in real (‘R’; F) and virtual reality (‘VR’; G) environments in the main experiment. (H) Comparisons of the average running speeds between the first five trials and the last five trials in both VR and R environments, showing a significant increase in both (n = 11, p<0.001, F(1,10)=40.11). (I–J) Average Rayleigh vector lengths of running direction across training trials in R (I) and VR (J). (K) Comparisons of the average Rayleigh vector lengths of running direction between the first five trials and the last five trials in both VR and R. Directionality was marginally higher in VR than in R (n = 11, p=0.053, F(1,10)=4.82) and did not change significantly with experience. (L–M) Average changes of running direction (absolute difference in direction between position samples) across training trials in R (L) and VR (M). (N) Comparisons of the changes of running direction between the first five and last five trials in both R and VR. Animals took straighter paths in VR than R (n = 11, p<0.001, F(1,10)=300.93), and paths became straighter with experience (n = 11, p<0.001, F(1,10)=26.82). Positions were sampled at 2.5 Hz with 400 ms boxcar smoothing in (I–N). All error bars show s.e.m.

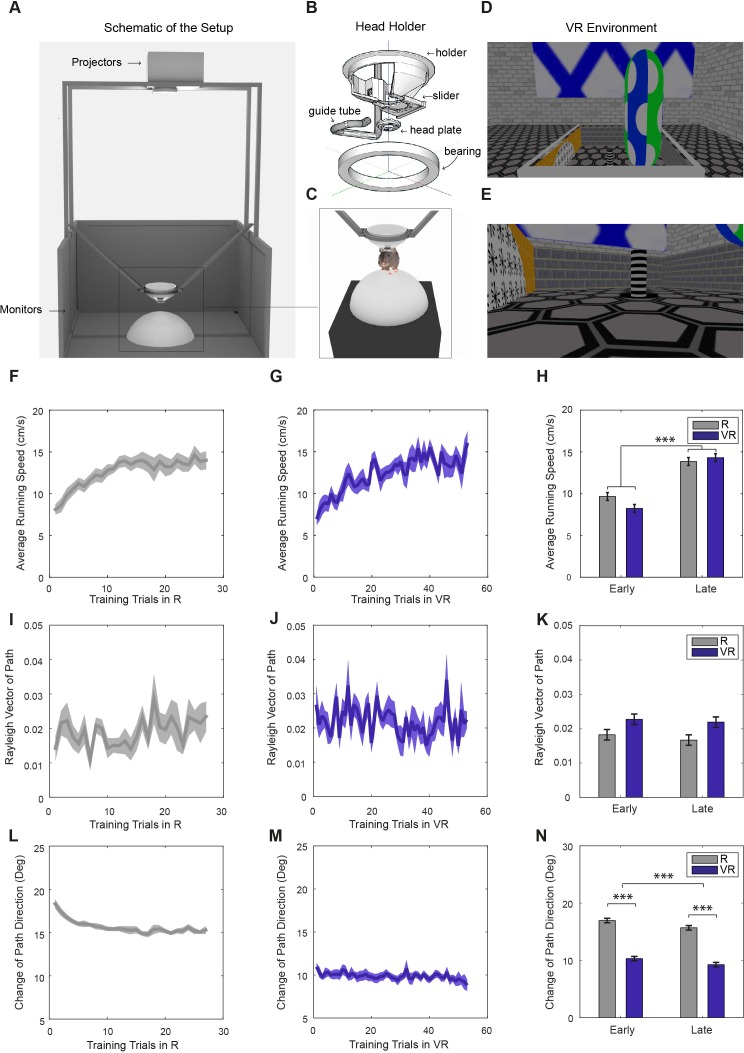
Figure 1.

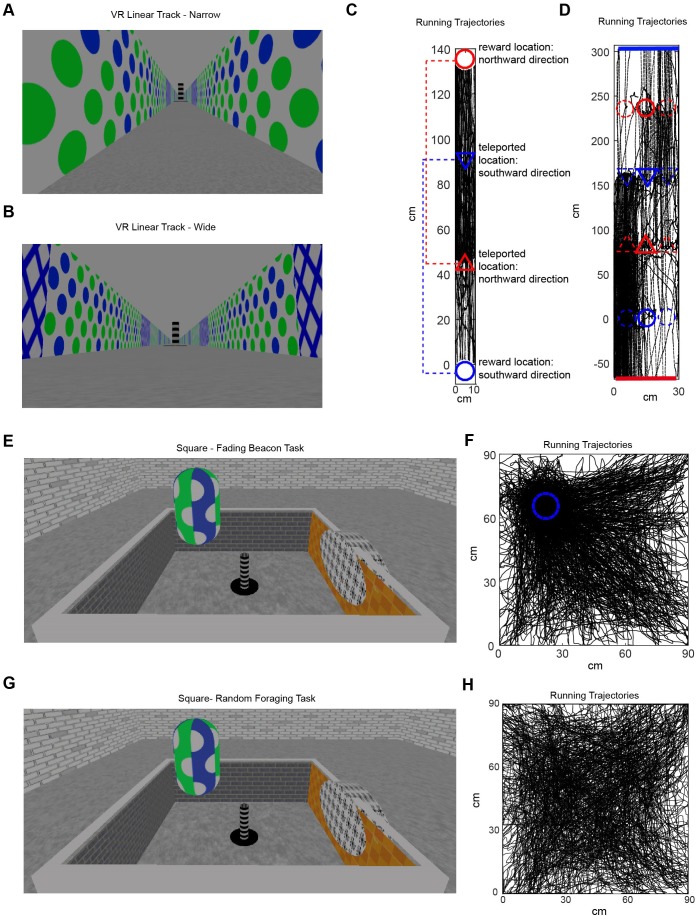
Figure 1—figure supplement 1. Example paths in the three training stages and the recording stage.

Figure 1—figure supplement 1.

(A) A view of the VR narrow linear track at training stage 1. (B) A view of the VR wide linear track at training stage 2. (C) An example running trajectory in the narrow linear track. Circles indicate reward locations, triangles indicate start points where animals get teleported after getting rewards. The start points were associated with the reward positions with matching colors (dotted lines). For example, a mouse gets teleported back to the position indicated by the blue triangle from the reward position indicated by the blue cycle. (D) An example running trajectory in the wide linear track. Circles indicate reward locations, bars indicate end points of the track, triangles indicate start points where animals get teleported after getting rewards or reaching the ends of the track. (E) A view of the virtual square at training stage 3 – the ‘fading beacon’ task. (F) An example trajectory when a mouse performing a ‘fading beacon’ task in the VR square. The dotted blue circle indicates the fixed location of every fourth reward. (G) A view of the virtual square during the recording stage – random foraging. (H) An example trajectory from a mouse foraging for randomly-positioned rewards in the VR square.

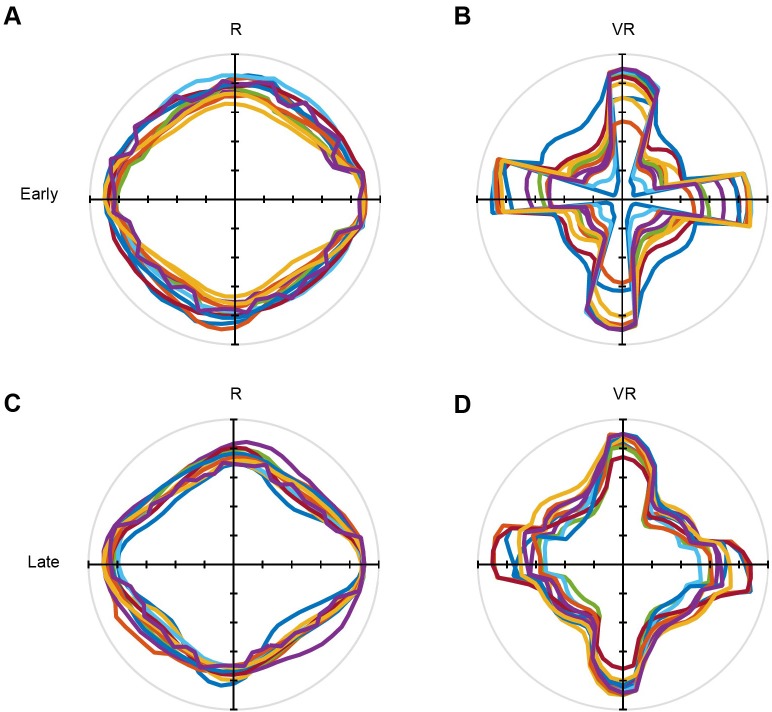
Figure 1—figure supplement 2. Directional polar plots of running directions in the VR square environment (n = 11 mice).

Figure 1—figure supplement 2.

(A–B) Average polar plot of running directions over the first five training trials in R (left column) and VR (right column). (C–D) Average polar plot of running directions over last five training trials in R (left column) and VR (right column). Each color represents one animal from the main experiment.

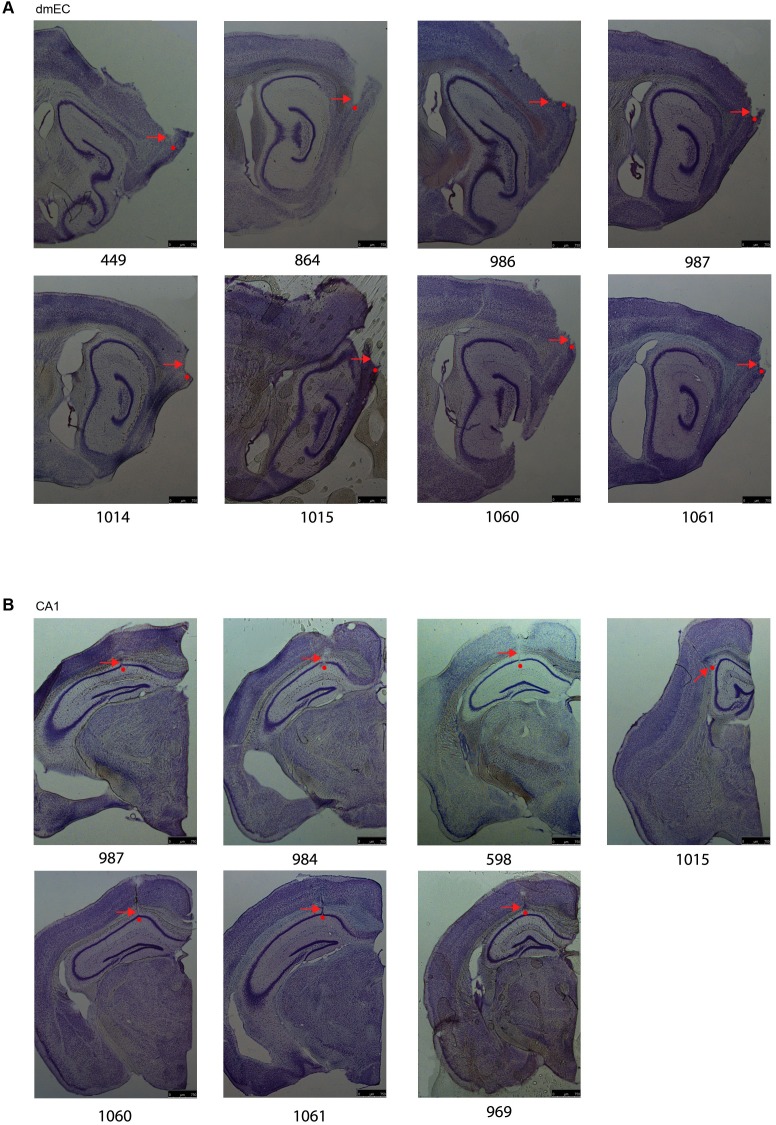
Figure 1—figure supplement 3. Nissl-stained brain sections from the 11 mice in the main experiment.

Figure 1—figure supplement 3.

(A) Eight sections from mice with tetrodes aimed at dorsomedial Entorhinal Cortex and (B) seven sections from mice with tetrodes aimed at dorsal CA1. The red arrows indicated the electrode tracks and the red dots marked the end points of the tracks. We note some technical difficulties with processing (e.g. A 1015, B 969).