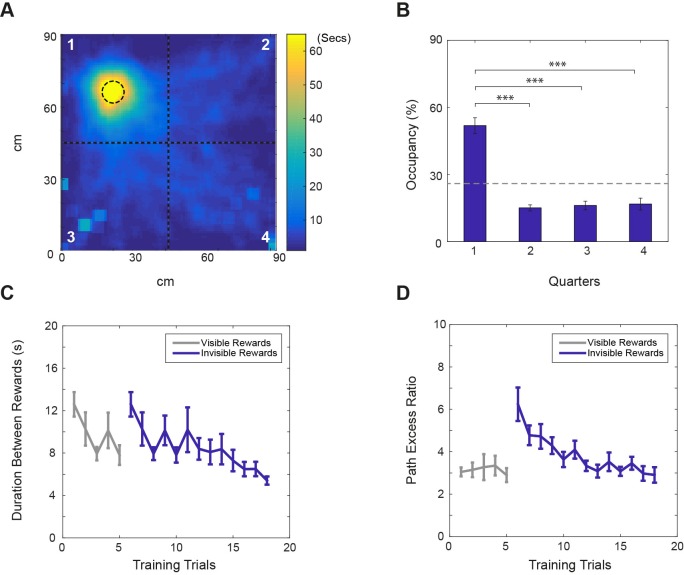
Figure 2. Performance on the ‘fading beacon’ task.
(A) An example heat map showing the distribution of locations between the third and the fourth rewards during a 40 min trial (mouse#987, trial#24). The dotted circle in the first quadrant shows the location of the faded reward. (B) Average time spent (as % of total time) in each quadrant of the VR square (numbered in A) showed a clear bias (n = 11, p<0.001, F(3,30)=39.03), with time spent in the first quadrant was significantly higher than in the others (*** denotes significance at p<0.001, ** at p<0.01). (C) Average durations between the third and the fourth rewards across training trials. (D) Average path excess ratios between the third and the fourth rewards across training trials (means ± s.e.m). Note that in each set of four rewards, the first, second and third rewards appeared at random locations in the virtual square, marked by visual beacons, the fourth reward was located at a fixed location. Grey lines show trials when the fixed-location rewards were marked by visual beacons. Blue lines show trials when the fixed rewards were not marked. See Supplementary video.

