. 2018 Jun 18;7:e34789. doi: 10.7554/eLife.34789

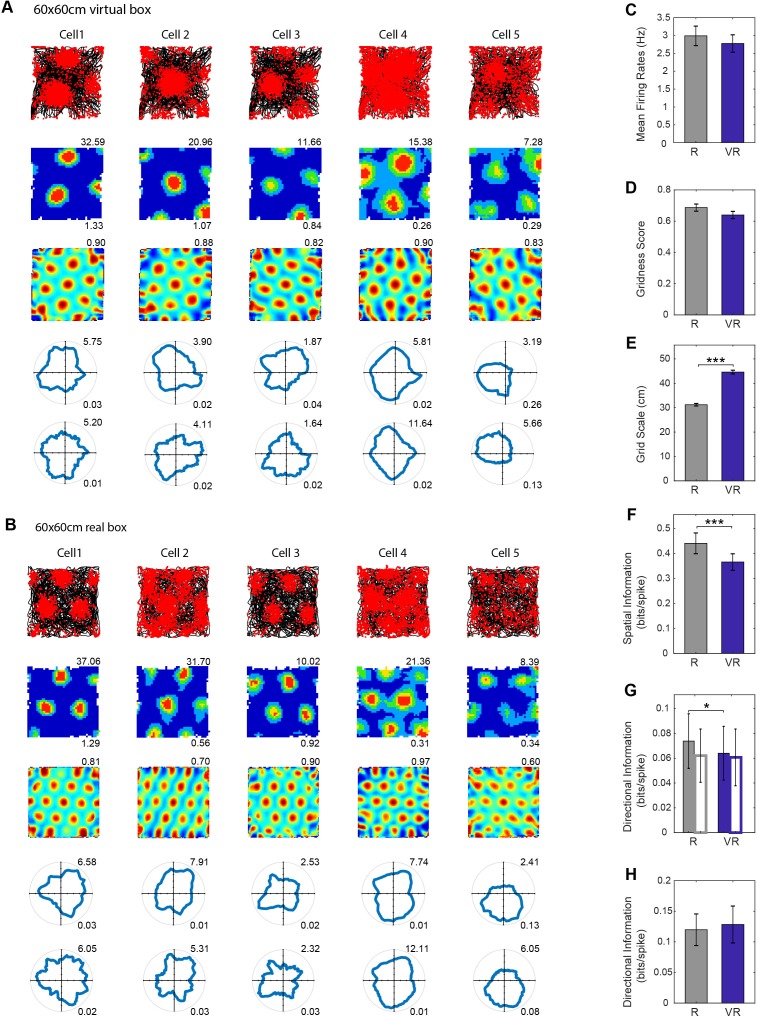
Figure 4. Grid cell firing in real and virtual environments.

(A–B) The same five grid cells simultaneously recorded in a 60 × 60 cm virtual square (A) and in a 60 × 60 cm real square (B, one cell per column). Top row: 40 min running trajectory (black line) with red dots showing the locations of spikes; second row, firing rate maps, maximum firing rate (Hz) shown top right, spatial information (bits/spike) bottom right; third row: spatial autocorrelations, gridness scores top right; fourth and fifth rows: polar plots of directional firing rates (fourth row: standard binning; fifth row: ‘pxd’ binning to account for inhomogeneous sampling), maximum firing rate top right, directional information bottom right. (C–H) Comparison between R (grey bars) and VR (blue bars): (C) Mean firing rates, higher in R than VR but not significantly so (n = 61, t(60)=1.71, p=0.09); (D) Gridness scores, higher in R than VR but not significantly so (n = 61, t(60)=1.67, p=0.10); (E) Grid scales, larger in VR than in R (n = 61, t(60)=15.52, p<0.001); (F) Spatial information in bits/spike, higher in R than VR (n = 61, t(60)=4.12, p<0.001); (G) Directional information. Grid cell firing was slightly more directional in VR than in R (n = 61, t(60)=2.04, p<0.05), but the difference disappeared when calculated using pxd plots (open bars, n = 61, t(60)=0.32, p=0.75); (H) Directional information in individual grid firing fields, not significant difference between the R and VR trials based on pxd plots (n = 61, t(60)=0.53, p=0.60).

Figure 4.

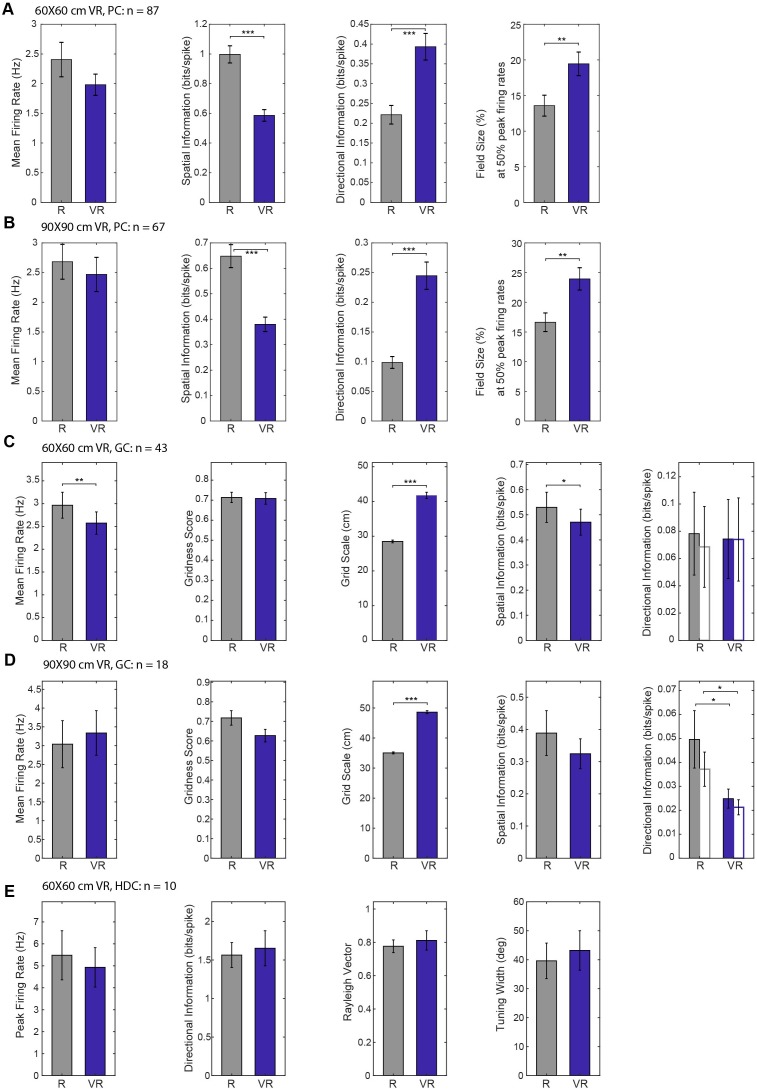
Figure 4—figure supplement 1. Breakdown of spatial firing properties in 60 × 60 cm or 90 × 90 cm VR environments.

Figure 4—figure supplement 1.

(A) Place cell properties in 60 cm VR compared to 60 cm R square. Spatial information was lower (n = 87, t(86)=7.31, p<0.001), directional information higher (n = 87, t(86)=-4.71, p<0.001) and field size larger (n = 87, t(86)=-3.06, p<0.001). (B) Comparison of place cell properties in 90 cm VR compared to 60 cm R. Spatial information was lower (n = 67, t(66)=5.20, p<0.001), directional information higher (n = 67, t(66)=-4.52, p<0.001) and field size larger (n = 67, t(66)=-3.13, p<0.01). (C) Grid cell properties in 60 cm VR compared to 60 cm R square. Mean firing rates were lower (n = 43, t(42)=3.19, p<0.01), grid scale larger (n = 43, t(42)=-11.53, p<0.001) and spatial information lower (n = 43, t(42)=2.41, p<0.05). Directional information was similar with standard (solid bars) and pxd binning (open bars). (D) Grid cell properties in 90 cm VR compared to 60 cm R square. Grid scales were larger (n = 18, t(17)=-22.72, p<0.001) and directional information was lower for both standard (solid bars, n = 18, t(17)=2.62, p<0.05) and pxd binning (open bars, n = 18, t(17)=2.76, p<0.05). (E) Head direction cell properties in 60 cm VR and 60 cm R square. None of the measures showed significant difference between R and VR (n = 10).
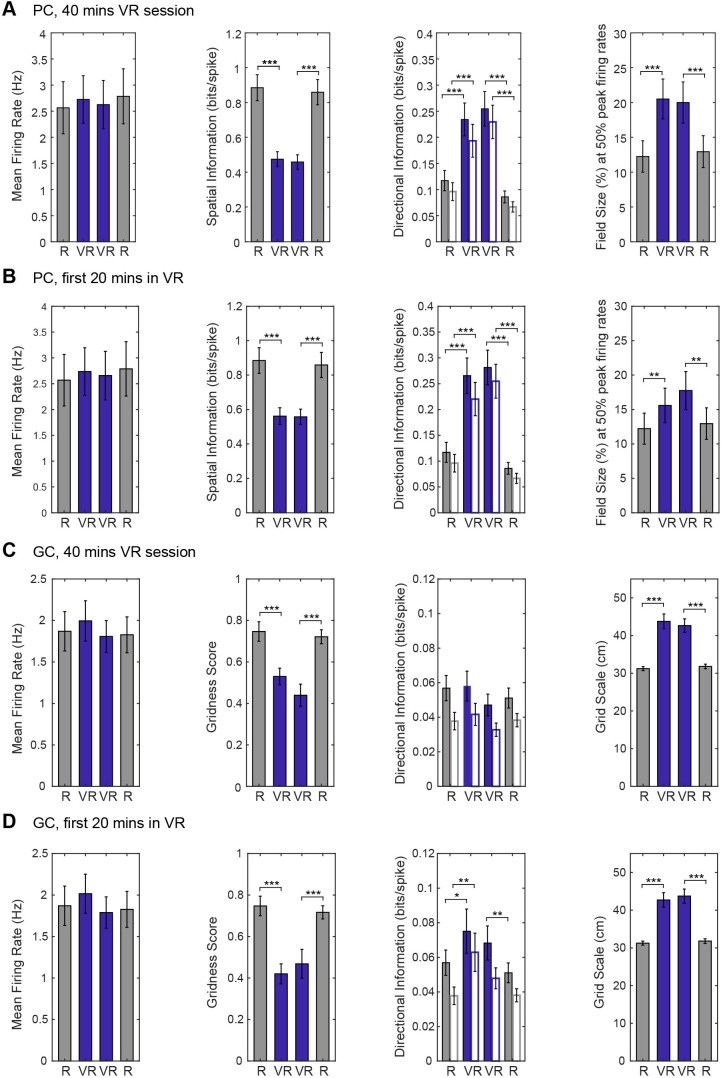
Figure 4—figure supplement 2. Trial order and trial length effects on comparing firing properties across VR and R environments in additional data from four mice.

Figure 4—figure supplement 2.

Two-way ANOVAs with factors of environment (VR vs R) and trial order (VR first vs R first) were performed. (A) Place cell firing properties comparing 20 min R trials with 40 min VR trials. Irrespective of trial order, spatial information was lower in VR (main effect, n = 85, F(1,84)=72.61, p<0.001; interaction, F(1,84)=0.03, p=0.85), field sizes were larger (main effect, F(1,84)=38.5, p<0.001; interaction, F(1,84)=0.47, p=0.49). Directional information was higher for both standard (solid bars, main effect, F(1,84)=33.25, p<0.001) and pxd binning (open bars; main effect, F(1,84)=25.90, p<0.001), with a greater difference when VR trials preceded R trials for both standard (interaction, F(1,84)=6.44, p<0.05) and pxd binning (interaction, F(1,84)=17.95, p<0.001). (B) Place cell firing properties comparing 20 min R trials with the first 20 min of VR trials. Irrespective of trial order, spatial information was lower in VR (main effect, n = 85, F(1,84)=47.04, p<0.001; interaction, F(1,84)=0.19, p=0.66) and field sizes were larger (main effect, F(1,84)=20.74, p<0.001; interaction, F(1,84)=0.53, p=0.47). Directional information was higher in VR for both standard (main effect, F(1,84)=44.82, p<0.001) and pxd binning (main effect, F(1,84)=36.50, p<0.001) and more so when VR trials preceded R trials (standard binning: interaction, F(1,84)=3.92, p=0.051; pxd binning: interaction, F(1,84)=13.01, p<0.001). (C) Grid cell firing properties comparing 20 min R trials with 40 min VR trials. Irrespective of the order of trials, gridness scores were lower in VR (main effect, n = 20, F(1,19)=34.82, p<0.001; interaction, F(1,19)=1.14, p=0.30) and grid scale was larger (main effect, F(1,19)=74.41, p<0.001; interaction F(1,19)=1.97, p=0.18). (D) Grid cell firing properties comparing 20 min R trials with the first 20 min of VR trials. Irrespective of order, gridness scores were lower in VR (main effect, n = 20, F(1,19)=102.90, p<0.001; interaction, F(1,19)=0.80, p=0.38), grid scale was larger (main effect, F(1,19)=75.91, p<0.001; interaction, F(1,19)=0.14, p=0.72) and directional information was higher in both standard binning (main effect, F(1,19)=9.58, p<0.01; interaction, F(1,19)=0.01, p=0.91) and pxd binning (main effect, F(1,19)=8.18, p=0.01; interaction, F(1,19)=4.09, p=0.06).