. 2018 Jun 18;7:e34789. doi: 10.7554/eLife.34789

Figure 5. Head direction cell firing in real and virtual environments.

(A–B) Polar plots of the same five HD cells in dmEC simultaneously recorded in R (A) and VR (B, one cell per column). Maximum firing rates are shown top right, Rayleigh vector length bottom right. (C–F) Comparisons of basic properties of HD cells in dmEC between R and VR. There were no significant differences in peak firing rates (t(11)=0.65, p=0.53; (C); directional information (t(11)=1.38, p=0.19; D); Rayleigh vector length (t(11)=1.69, p=0.12; E); and tuning width (t(11)=0.48, p=0.64; F).

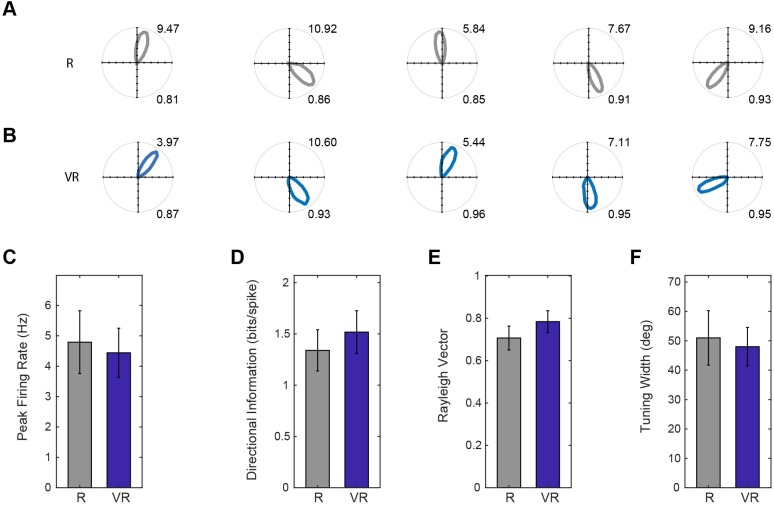
Figure 5.

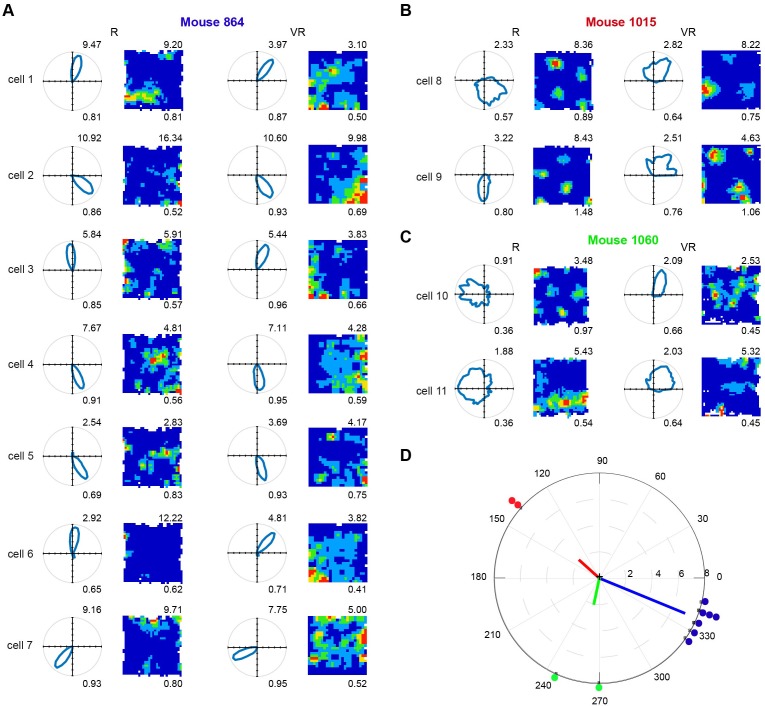
Figure 5—figure supplement 1. Eleven directional cells recorded in dmEC.

Figure 5—figure supplement 1.

(A) Polar plots (left column) and firing rate maps (right column) of seven cells found in mouse 1. (B) Two conjunctive grid cells found in mouse 2. (C) Two cells found in mouse 3. Numbers on the top right show maximum firing rates, and on the bottom show Rayleigh vector length (left columns) and spatial information (right columns). (D) The relative directional tuning difference of simultaneously recorded head-direction cells between VR and R: Mouse 1 (blue), 337.71 ± 8.28; Mouse 2 (red), 138.0 ± 0.00; Mouse 3 (green), 258.00 ± 16.97. The dots represent the relative directional tuning difference of individual cells between VR and R. The lines represent the mean tuning difference within the animals. Each dot represents one cell, and each color represents one animal.