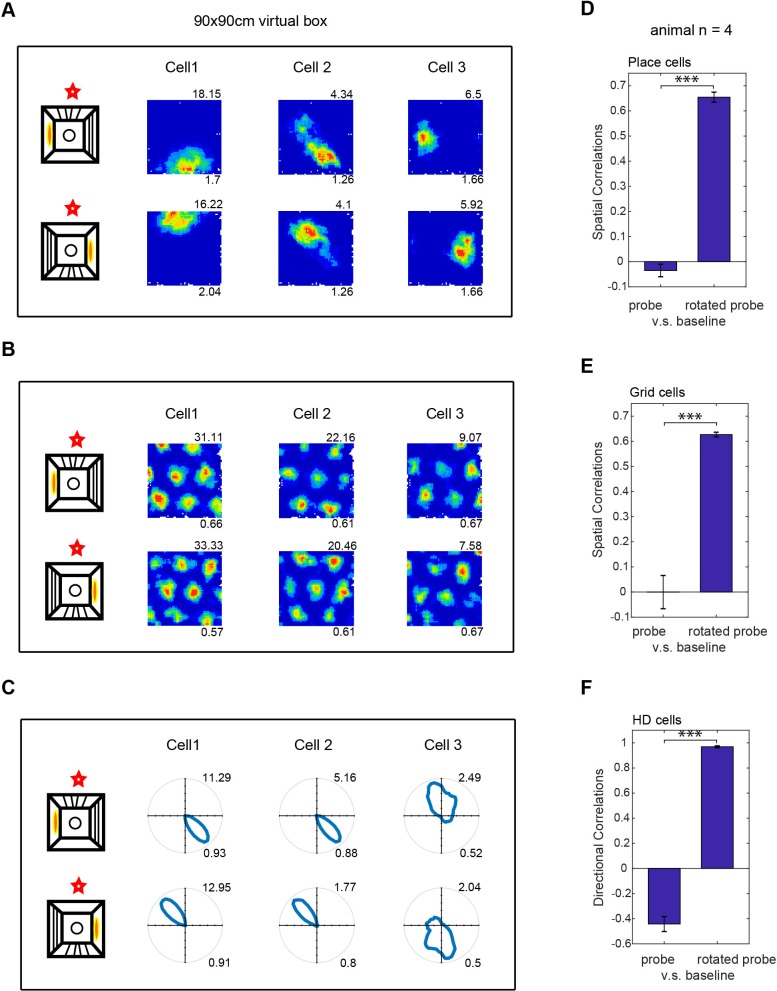
Figure 6. Effect of rotating the virtual environment on spatial firing patterns.
(A–C) Three simultaneously recorded CA1 place cells (A), dmEC grid cells (B) and dmEC head-direction cells (C). Upper rows show firing patterns in baseline trials, lower rows show the rotated probe trials. Schematic (far let) shows the manipulation: virtual cues and entry point were rotated 180o relative to the real environment (marked by a red star). Maximum firing rates are shown top right, spatial information (A), gridness (B) or Rayleigh vector length (C) bottom right. (D–F) Spatial correlations between probe and baseline trials were significantly higher when the probe trial rate map was rotated 180o than when it was not (spatial correlations for place cells, n = 123, t(122)=19.44, p<0.001; grid cells, n = 18, t(17)=9.41, p<0.001; HD cells, n = 17, t(16)=24.77, p<0.001).
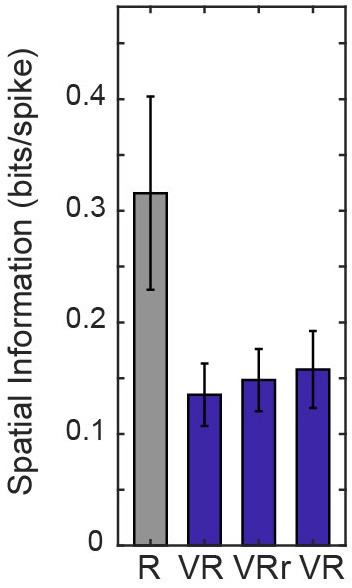
Figure 6—figure supplement 1. Spatial information of place cells that did not follow the 180 degree rotation of VR environment (n = 7, spatial information were 0.32 ± 0.23, 0.14 ± 0.07, 0.15 ± 0.07 and 0.16 ± 0.09 in R, VR control, VR rotated and VR control trials respectively).


