. 2018 Jun 18;7:e34789. doi: 10.7554/eLife.34789

Figure 7. Effect of running speed on theta frequency and firing rates in real and virtual environments.

Relationship between running speed in VR (blue) and R (black) on instantaneous LFP theta frequency in CA1 (A, n = 6); instantaneous LFP theta frequency in dmEC (B, n = 5); firing rates of place cells in CA1 (C, n = 154); firing rates of grid cells in dmEC (D, n = 61); speed-modulated cells in CA1 (E, n = 55); firing rates of speed-modulated cells in dmEC (F, n = 26). Lines show the mean (±s.e.m) theta frequency in each running speed bin (2.5 cm/s to 30 cm/s).

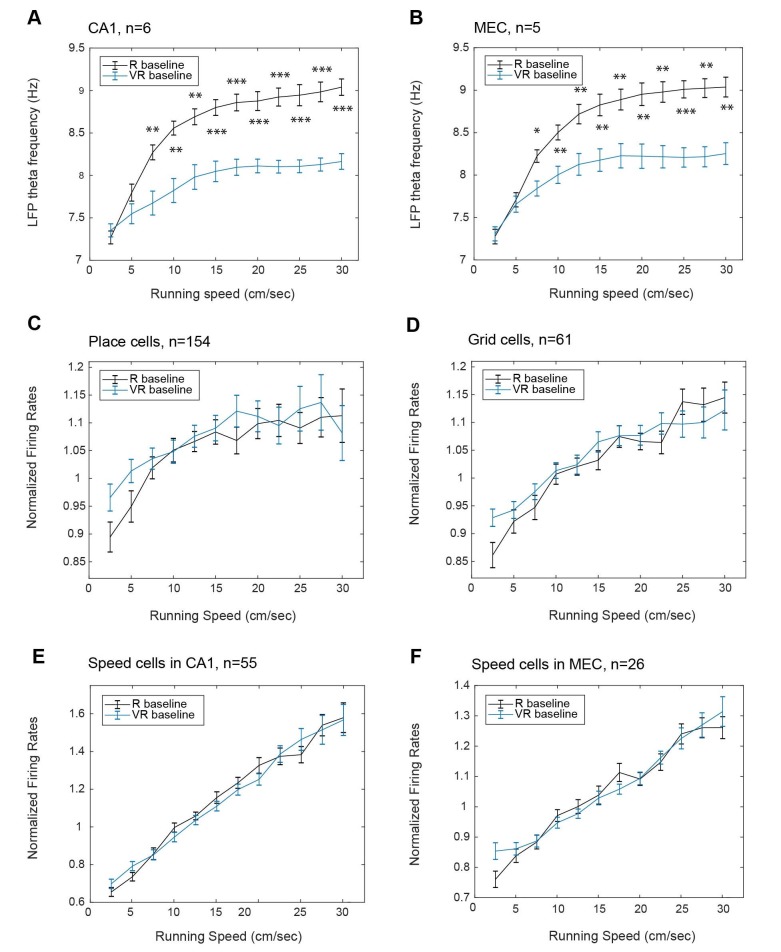
Figure 7.

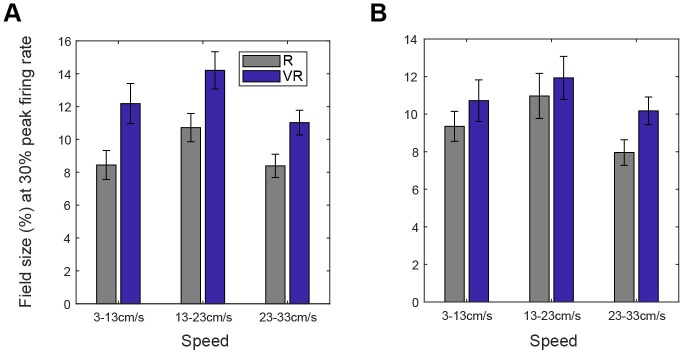
Figure 7—figure supplement 1. Spatial cell field size was modulated by running speed in a similar way in R and VR environments.

Figure 7—figure supplement 1.

(A) Comparison of grid field size when sampled in different speed ranges. Field size (as a percentage of the area of the environment) were significantly different across the three speed ranges (n = 61, F(2, 120)=7.06, p<0.01) and between VR and R environments (n = 61, F(1, 60)=21.28, p<0.001) but there was no interaction between effects of speed and environment on size (n = 61, F(2, 120)=0.52, p=0.60). (B) Comparison of place cell field size when sampled in different speed ranges. Field sizes were different across speed ranges (n = 154, F(2, 306)=11.13, p<0.001), the effect of environment approached significance (F(1,153)=3.50, p=0.06) and there was no interaction between effects of environment and speed (F(2, 306)=1.98, p=0.14).