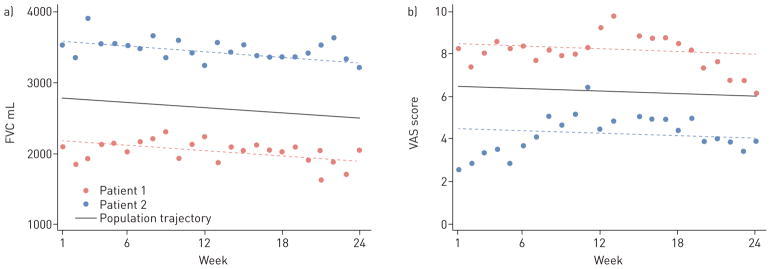
FIGURE 4.
Weekly home measurements demonstrating correlation structures. a) Hand-held forced vital capacity (FVC) measures over time for two simulated patients typical of the sample. The circles represent each weekly FVC measure and the dotted lines represent the individual’s modelled linear trajectory over 24 weeks. These plots demonstrate a compound symmetrical correlation structure: that is, the correlation between any two measures within an individual is independent of the time lag between the two measures. b) Home dyspnoea visual analogue scale (VAS) scores over time for two simulated patients typical of the sample. The circles represent each weekly VAS measure and the dotted lines represent the individual’s modelled linear trajectory over 24 weeks. The plots demonstrate a declining correlation structure: that is, the correlation between any two measures within an individual decreases as the time between the two measures increases.

