Figure 3.

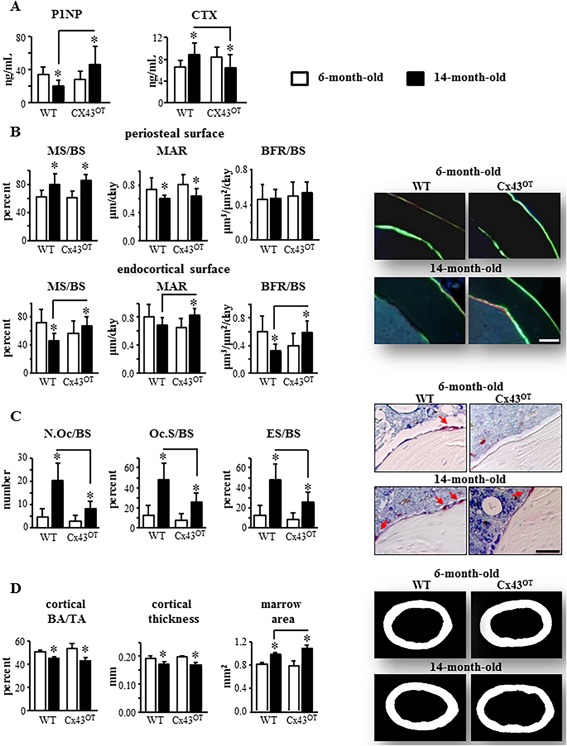
Fourteen‐month‐old Cx43OT mice exhibit enhanced endocortical bone formation and decreased resorption. (A) Circulating levels for P1NP and CTX were measured by ELISA in serum collected from 6‐ and 14‐month‐old mice. Six‐month‐old mice: n = 10 WT and n = 9 Cx43OT, 14‐month‐old mice: n = 11 WT and n = 9 Cx43OT. (B) Periosteal and endosteal MS/BS, MAR, and BFR/BS were measured in unstained sections from the femoral mid‐diaphysis. Six‐month‐old mice: n = 9 WT and n = 9 Cx43OT, 14‐month‐old mice: n = 8 WT and n = 7 Cx43OT. Representative images are shown. Scale bars = 100 μm. (C) N.Oc/BS, Oc.S/BS, ES/BS were scored in femoral cortical mid‐diaphysis after staining for TRAP/Toluidine blue in Cx43OT and WT mice. Six‐month‐old mice: n = 9 WT and n = 9 Cx43OT, 14‐month‐old mice: n = 5 WT and n = 7 Cx43OT. Osteoclasts on the bone surface (arrow, red) are shown. (D) Cortical bone geometry was evaluated by µCT in the femoral mid‐diaphysis. Six‐month‐old mice: n = 8 WT and n = 9 Cx43OT, 14‐month‐old mice: n = 8 WT and n = 6 Cx43OT. Representative reconstructed images of the femoral mid‐diaphysis are shown. Bars represent mean ± SD, *p < 0.05, versus 6‐month‐old genotype‐matched mice by two‐way ANOVA, Tukey, black line: p < 0.05, versus old control mice by t test.
