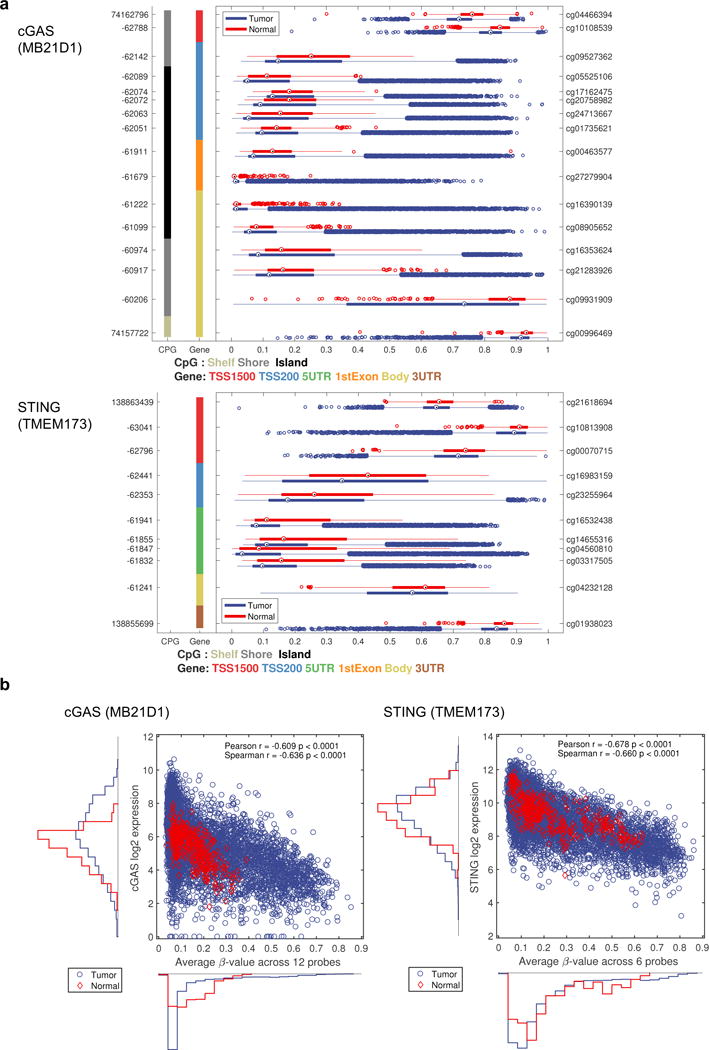
Figure 6.

cGAS and STING expression is suppressed by methylation in a pan-tumor analysis. (a) The methylation data 32 different tumors types were obtained from TCGA. The methylation level for the 16 probes available for cGAS and the 11 probes available for STING on Illumina 450K chip are shown as box plots for normal samples (red) and tumor samples (blue). The x-axis indicates methylation level by β-value, ranging from 0 to 1 where 0 means no methylation and 1 means 100% methylated. The y-axis shows the genomic position (left axis) and probe ID (right axis) for all the probes. The colored columns indicate CpG island and gene body type as described in the figure. (b) The gene expression for cGAS or STING versus the average β-value across selected 12 probes for cGAS or 6 probes for STING.
