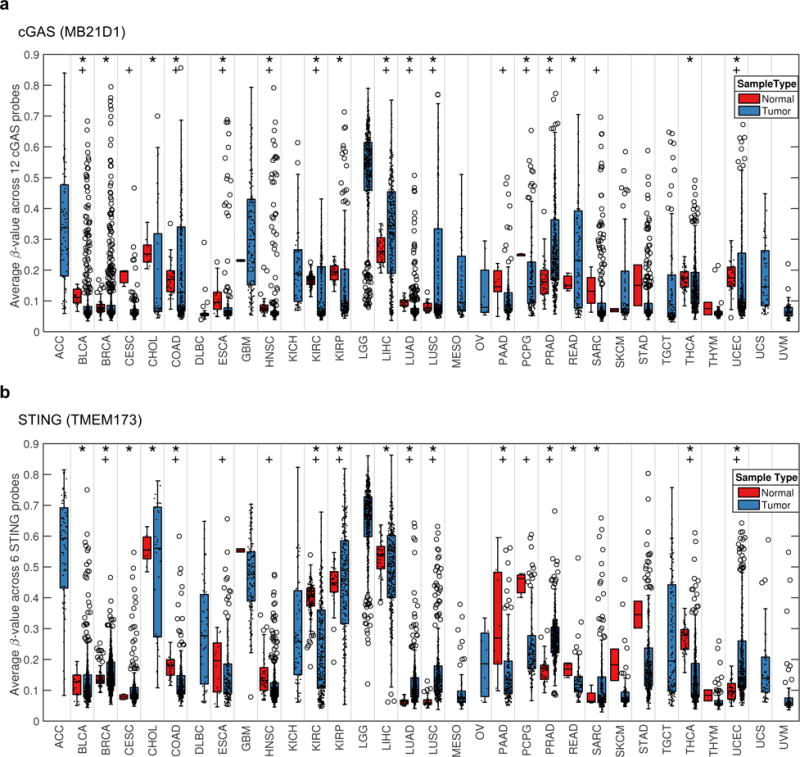
Figure 7.

cGAS and STING show a large variability in methylation for a variety of human tumors. (a and b) The average methylation level across 32 tumor types are shown in box plots for cGAS (a) or STING (b). Each individual sample is also represented by a dot (.) and outlier samples are indicated by circles (o). The statistical analysis was performed by Bartlett’s test (*; p<0.05) and Fisher’s exact test for enrichment of tumors in the 75th percentile (+; p<0.05). Abbreviation for each tumor type is shown in Supplementary Information.
