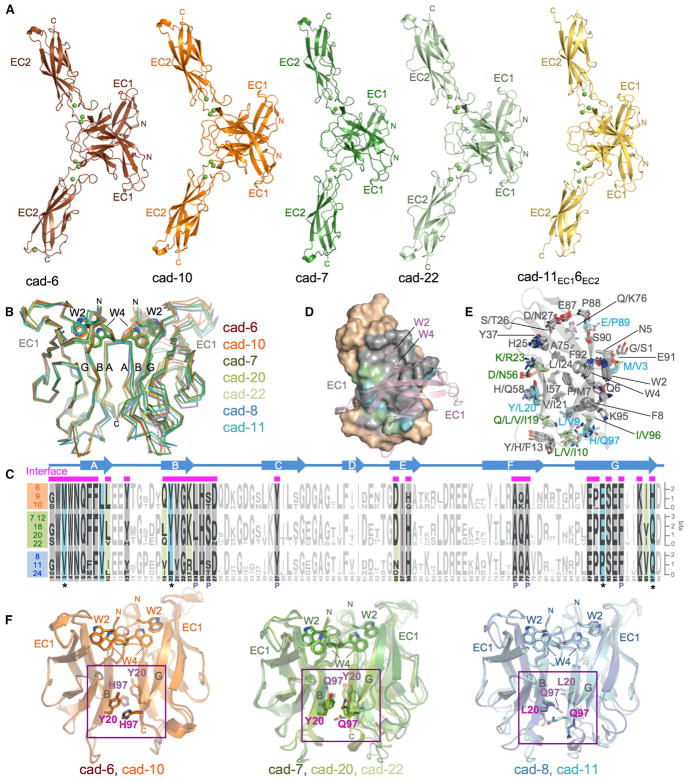
Figure 4. Crystal Structures of Type II Cadherin Homodimers and Analysis of Specificity Determinants.
(A) Ribbon representation of strand-swapped EC1-EC2 homodimer structures of cadherin-6, cadherin-10, cadherin-7, cadherin-22, and chimera cad-11EC16EC2. Three Ca2+ ions (green spheres) are coordinated by interdomain linker regions of each protomer.
(B) Superposition of EC1 homodimers reported here and in Patel et al. (2006) shown as carbon-α traces superposed over the left protomer. Docked strand-swap residues Trp2 and Trp4 are shown in stick representation.
(C) Sequence logos of aligned EC1 regions of type II cadherins from human, mouse, and chicken (Experimental Procedures) separated into specificity groups. Positions containing, or flanked by, interface residues (marked by magenta bars above alignment) are shown in bold and colored according to conservation. Cyan: residues fully conserved within but different between specificity groups. Green: residues differing between specificity groups but not fully conserved within each. Gray: positions with identical conserved consensus residues across all specificity groups. Secondary structure elements of cadherin-6 are shown above the logos. Pocket residues are indicated with P.
(D) Surface representation of EC1, with interface residues colored according to (C). Salmon: partner protomer in ribbon representation.
(E) Interface residues, colored according to (C), shown as sticks in a superposition of EC1 domain structures. The main chain ribbon is shown only for cadherin-6.
(F) Potential specificity determinants (magenta) shown as sticks on superposed EC1 domain homodimers for members of each specificity group. Trp2 and Trp4 are shown for orientation.
See also Table S3.

