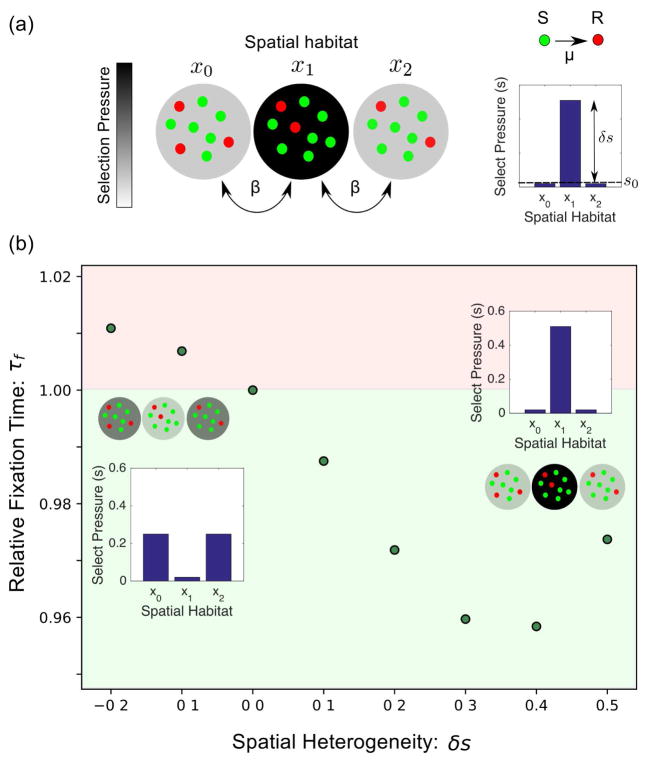
FIG. 1.
(a) Stochastic model for emergence and spread of resistant cells (red) in a spatially extended population of sensitive cells (green). Each spatial habitat (xi) contains N total cells. Cells migrate at a rate β between neighboring habitats, and sensitive cells mutate at a rate μ to resistant cells. The spatial distribution of selection pressure is characterized by a background value (s0) and a peak height (δs). (b) Example plot of the mean fixation time for different landscapes with μ = 5 × 10⁻³, β = 0.08, N = 25, and 〈s〉 = 0.167. The time to fixation can be either faster (green) or slower (red) than the spatially homogeneous landscape with δs = 0. Inset: selection landscapes for δs = −0.2 and δs = 0.5.

